Zoom, Scroll, and Preview Charts
Overview
Chart zooming, scrolling, and preview are interactive features that allow users to zoom in and out of areas on a chart. They can be enabled on the x-, y-, and/or additional axes, and are especially useful on charts with large datasets.
Zooming
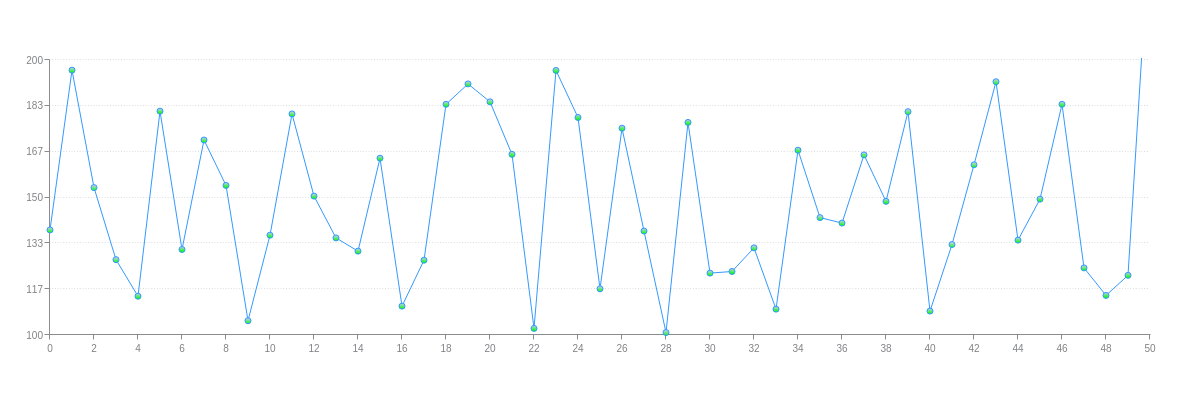
Zooming allows users to select and zoom in on an area of the chart by clicking and dragging around the area they want enlarged. Chart zooming can also be performed by right-clicking to bring up the context menu to zoom in, zoom out, or view the entire chart.
Setup
To enable zooming on your chart, you need to:
Note: The zooming attribute is required to enable the zooming on the axes.
Tip: In the following chart, click and drag to zoom in on a section of the chart.
{
  type: "line",
  'scale-x': {
    zooming: true,
    item: {
      'font-size':10
    }
  },
  'scale-y': {
    zooming: true,
    values: "50:350:50",
    guide: {
      'line-style': "dotted"
    },
    item: {
      'font-size':10
    }
  },
  plot: {
    'line-width':1,
    'line-color': "#3399ff",
    marker: {
      size:3,
      'background-color': "#ccccff #00ff00",
      'border-width': 1,
      'border-color': "#3399ff"
    },
    tooltip: {
      visible: false
    }
  },
  'crosshair-x': {
    'plot-label': {
      text: "%v"
    },
    'scale-label': {
      visible: false
    }
  },
  'crosshair-y': {
    type: "multiple",
    'scale-label': {
      visible: false
    }
  },
  series: [
    {
      values: [
        138.2,196.3,153.6,127.4,114.1,181.4,131.1,170.9,154.4,105.2,
        136.3,180.4,150.5,135.3,130.5,164.3,110.5,127.2,183.9,191.3,
        184.8,165.7,102.4,196.2,179.1,116.8,175.2,137.8,100.9,177.3,
        122.5,123.1,131.7,109.4,167.2,142.7,140.7,165.5,148.6,181.2,
        108.7,132.9,161.9,192.1,134.5,149.4,183.9,124.4,114.4,121.7,
        249.6,224.3,199.3,151.4,112.4,213.5,265.3,239.5,294.6,284.4,
        279.2,273.7,233.7,290.1,228.2,269.3,208.4,224.6,235.1,222.5,
        225.7,257.2,238.1,262.5,229.6,269.7,283.9,236.2,260.8,255.2,
        258.1,219.5,292.4,264.8,251.7,225.9,206.5,203.3,258.2,200.7,
        237.2,208.1,262.7,292.8,249.2,242.6,284.4,246.7,275.9,274.5,
        234.2
      ]
    }
  ]
}
To have the chart zoom to specified scale values by default at chart render, add the zoom-to or zoom-to-values array. Use the former when setting values by node index (best for simple array data), and use the latter when setting values by node value (best for array of array data such as time-series).
{
  type: "line",
  'scale-x': {
    zooming: true,
    'zoom-to': [0,50],
    item: {
      'font-size':10
    }
  },
  'scale-y': {
    zooming: true,
    'zoom-to': [100,200],
    values: "50:350:50",
    guide: {
      'line-style': "dotted"
    },
    item: {
      'font-size':10
    }
  },
  plot: {
    'line-width':1,
    'line-color': "#3399ff",
    marker: {
      size:3,
      'background-color': "#ccccff #00ff00",
      'border-width': 1,
      'border-color': "#3399ff"
    },
    tooltip: {
      visible: false
    }
  },
  'crosshair-x': {
    'plot-label': {
      text: "%v"
    },
    'scale-label': {
      visible: false
    }
  },
  'crosshair-y': {
    type: "multiple",
    'scale-label': {
      visible: false
    }
  },
  series: [
    {
      values: [
        138.2,196.3,153.6,127.4,114.1,181.4,131.1,170.9,154.4,105.2,
        136.3,180.4,150.5,135.3,130.5,164.3,110.5,127.2,183.9,191.3,
        184.8,165.7,102.4,196.2,179.1,116.8,175.2,137.8,100.9,177.3,
        122.5,123.1,131.7,109.4,167.2,142.7,140.7,165.5,148.6,181.2,
        108.7,132.9,161.9,192.1,134.5,149.4,183.9,124.4,114.4,121.7,
        249.6,224.3,199.3,151.4,112.4,213.5,265.3,239.5,294.6,284.4,
        279.2,273.7,233.7,290.1,228.2,269.3,208.4,224.6,235.1,222.5,
        225.7,257.2,238.1,262.5,229.6,269.7,283.9,236.2,260.8,255.2,
        258.1,219.5,292.4,264.8,251.7,225.9,206.5,203.3,258.2,200.7,
        237.2,208.1,262.7,292.8,249.2,242.6,284.4,246.7,275.9,274.5,
        234.2
      ]
    }
  ]
}
Shared Zooming
When you have multiple charts in a graphset, the shared zooming feature allows you to zoom in on all of the charts simultaneously. To enable shared zooming, you need to do the following for each chart:
See the following chart.

{
  layout: "3x1",
  graphset: [
    {
      type: "line",
      zoom: {
        shared: true,
        'background-color': "#3399ff"
      },
      'scale-x': {
        zooming: true,
        'max-items':11,
        item: {
          'font-size':10
        }
      },
      'scale-y': {
        values: "0:300:150",
        item: {
          'font-size':10
        }
      },
      plot: {
        'line-color': "#3399ff",
        marker: {
          'background-color': "#3399ff"
        }
      },
      plotarea: {
        margin: "dynamic"
      },
      series: [
        {
          values: [
            138.2,196.3,153.6,127.4,114.1,181.4,131.1,170.9,154.4,105.2,
            136.3,180.4,150.5,135.3,130.5,164.3,110.5,127.2,183.9,191.3,
            184.8,165.7,102.4,196.2,179.1,116.8,175.2,137.8,100.9,177.3,
            122.5,123.1,131.7,109.4,167.2,142.7,140.7,165.5,148.6,181.2,
            108.7,132.9,161.9,192.1,134.5,149.4,183.9,124.4,114.4,121.7,
            249.6,224.3,199.3,151.4,112.4,213.5,265.3,239.5,294.6,284.4,
            279.2,273.7,233.7,290.1,228.2,269.3,208.4,224.6,235.1,222.5,
            225.7,257.2,238.1,262.5,229.6,269.7,283.9,236.2,260.8,255.2,
            258.1,219.5,292.4,264.8,251.7,225.9,206.5,203.3,258.2,200.7,
            237.2,208.1,262.7,292.8,249.2,242.6,284.4,246.7,275.9,274.5,
            234.2
          ]
        }
      ]
    },
    {
      type: 'bar',
      zoom: {
        shared: true,
        'background-color': "#ff0080"
      },
      'scale-x': {
        zooming: true,
        'max-items':11,
        item: {
          'font-size':10
        }
      },
      'scale-y': {
        values: "0:300:150",
        item: {
          'font-size':10
        }
      },
      plot: {
        'background-color': "#ff0080",
        'bar-width': "50%"
      },
      plotarea: {
        margin: "dynamic"
      },
      series: [
        {
          values: [
            138.2,196.3,153.6,127.4,114.1,181.4,131.1,170.9,154.4,105.2,
            136.3,180.4,150.5,135.3,130.5,164.3,110.5,127.2,183.9,191.3,
            184.8,165.7,102.4,196.2,179.1,116.8,175.2,137.8,100.9,177.3,
            122.5,123.1,131.7,109.4,167.2,142.7,140.7,165.5,148.6,181.2,
            108.7,132.9,161.9,192.1,134.5,149.4,183.9,124.4,114.4,121.7,
            249.6,224.3,199.3,151.4,112.4,213.5,265.3,239.5,294.6,284.4,
            279.2,273.7,233.7,290.1,228.2,269.3,208.4,224.6,235.1,222.5,
            225.7,257.2,238.1,262.5,229.6,269.7,283.9,236.2,260.8,255.2,
            258.1,219.5,292.4,264.8,251.7,225.9,206.5,203.3,258.2,200.7,
            237.2,208.1,262.7,292.8,249.2,242.6,284.4,246.7,275.9,274.5,
            234.2
          ]
        }
      ]
    },
    {
      type: "area",
      zoom: {
        shared: true,
        'background-color': "#4d9900"
      },
      'scale-x': {
        zooming: true,
        'max-items':11,
        item: {
          'font-size':10
        }
      },
      'scale-y': {
        values: "0:300:150",
        item: {
          'font-size':10
        }
      },
      plot: {
        'line-color': "#4d9900",
        'background-color': "#4d9900",
        marker: {
          'background-color': "#4d9900"
        }
      },
      plotarea: {
        margin: "dynamic"
      },
      series: [
        {
          values: [
            138.2,196.3,153.6,127.4,114.1,181.4,131.1,170.9,154.4,105.2,
            136.3,180.4,150.5,135.3,130.5,164.3,110.5,127.2,183.9,191.3,
            184.8,165.7,102.4,196.2,179.1,116.8,175.2,137.8,100.9,177.3,
            122.5,123.1,131.7,109.4,167.2,142.7,140.7,165.5,148.6,181.2,
            108.7,132.9,161.9,192.1,134.5,149.4,183.9,124.4,114.4,121.7,
            249.6,224.3,199.3,151.4,112.4,213.5,265.3,239.5,294.6,284.4,
            279.2,273.7,233.7,290.1,228.2,269.3,208.4,224.6,235.1,222.5,
            225.7,257.2,238.1,262.5,229.6,269.7,283.9,236.2,260.8,255.2,
            258.1,219.5,292.4,264.8,251.7,225.9,206.5,203.3,258.2,200.7,
            237.2,208.1,262.7,292.8,249.2,242.6,284.4,246.7,275.9,274.5,
            234.2
          ]
        }
      ]
    }
  ]
}
Scroll Step Multiplier
Sets the multiplier value to apply to each step when scrolling the chart.
{
  plot: {
    scrollStepMultiplier: 2
  },
}
Styling
You can style the zoom area that appears when you click and drag with the mouse. You can also add zooming labels, which allow for better precision when selecting a zoom area.
Zoom Area
To style the zoom area, place your desired attributes inside the zoom object. You can change the background-color, border-color, border-width, and alpha transparency levels. Refer to the "zoom" object JSON Attributes/Syntax page for a full list of styling attributes.

{
  type: "line",
  zoom: {
    'background-color': "#ccccff",
    'border-width':5,
    'border-color': "#3399ff",
    alpha:0.3
  },
  'scale-x': {
    zooming: true,
    item: {
      'font-size':10
    }
  },
  'scale-y': {
    zooming: true,
    values: "50:350:50",
    guide: {
      'line-style': "dotted"
    },
    item: {
      'font-size':10
    }
  },
  plot: {
    'line-width':1,
    'line-color': "#3399ff",
    marker: {
      size:3,
      'background-color': "#ccccff #00ff00",
      'border-width': 1,
      'border-color': "#3399ff"
    },
    tooltip: {
      visible: false
    }
  },
  'crosshair-x': {
    'plot-label': {
      text: "%v"
    },
    'scale-label': {
      visible: false
    }
  },
  'crosshair-y': {
    type: "multiple",
    'scale-label': {
      visible: false
    }
  },
  series: [
    {
      values: [
        138.2,196.3,153.6,127.4,114.1,181.4,131.1,170.9,154.4,105.2,
        136.3,180.4,150.5,135.3,130.5,164.3,110.5,127.2,183.9,191.3,
        184.8,165.7,102.4,196.2,179.1,116.8,175.2,137.8,100.9,177.3,
        122.5,123.1,131.7,109.4,167.2,142.7,140.7,165.5,148.6,181.2,
        108.7,132.9,161.9,192.1,134.5,149.4,183.9,124.4,114.4,121.7,
        249.6,224.3,199.3,151.4,112.4,213.5,265.3,239.5,294.6,284.4,
        279.2,273.7,233.7,290.1,228.2,269.3,208.4,224.6,235.1,222.5,
        225.7,257.2,238.1,262.5,229.6,269.7,283.9,236.2,260.8,255.2,
        258.1,219.5,292.4,264.8,251.7,225.9,206.5,203.3,258.2,200.7,
        237.2,208.1,262.7,292.8,249.2,242.6,284.4,246.7,275.9,274.5,
        234.2
      ]
    }
  ]
}
Zoom Labels
To add zooming labels, create a label object inside the zoom object. Add a visible attribute, and set the value to true. You can style the background, borders, font, padding, and placement of the labels. Refer to the "label" object JSON Attributes/Syntax page for a full list of styling attributes.
{
  type: "line",
  zoom: {
    label: { //Zooming Labels
      visible: true,
      'font-color': "#3399ff",
      'font-family': "Georgia",
      'font-size':10,
      'font-style': "normal", //"italic" or "normal"
      'font-weight': "normal", //"bold" or "normal"
      'background-color': "white",
      'border-width': 1,
      'border-color': "#3399ff",
      alpha:0.7,
      padding: "5%"
    }
  },
  'scale-x': {
    zooming: true,
    item: {
      'font-size':10
    }
  },
  'scale-y': {
    zooming: true,
    values: "50:350:50",
    guide: {
      'line-style': "dotted"
    },
    item: {
      'font-size':10
    }
  },
  plot: {
    'line-width':1,
    'line-color': "#3399ff",
    marker: {
      size:3,
      'background-color': "#ccccff #00ff00",
      'border-width': 1,
      'border-color': "#3399ff"
    },
    tooltip: {
      visible: false
    }
  },
  'crosshair-x': {
    'plot-label': {
      text: "%v"
    },
    'scale-label': {
      visible: false
    }
  },
  'crosshair-y': {
    type: "multiple",
    'scale-label': {
      visible: false
    }
  },
  series: [
    {
      values: [
        138.2,196.3,153.6,127.4,114.1,181.4,131.1,170.9,154.4,105.2,
        136.3,180.4,150.5,135.3,130.5,164.3,110.5,127.2,183.9,191.3,
        184.8,165.7,102.4,196.2,179.1,116.8,175.2,137.8,100.9,177.3,
        122.5,123.1,131.7,109.4,167.2,142.7,140.7,165.5,148.6,181.2,
        108.7,132.9,161.9,192.1,134.5,149.4,183.9,124.4,114.4,121.7,
        249.6,224.3,199.3,151.4,112.4,213.5,265.3,239.5,294.6,284.4,
        279.2,273.7,233.7,290.1,228.2,269.3,208.4,224.6,235.1,222.5,
        225.7,257.2,238.1,262.5,229.6,269.7,283.9,236.2,260.8,255.2,
        258.1,219.5,292.4,264.8,251.7,225.9,206.5,203.3,258.2,200.7,
        237.2,208.1,262.7,292.8,249.2,242.6,284.4,246.7,275.9,274.5,
        234.2
      ]
    }
  ]
}
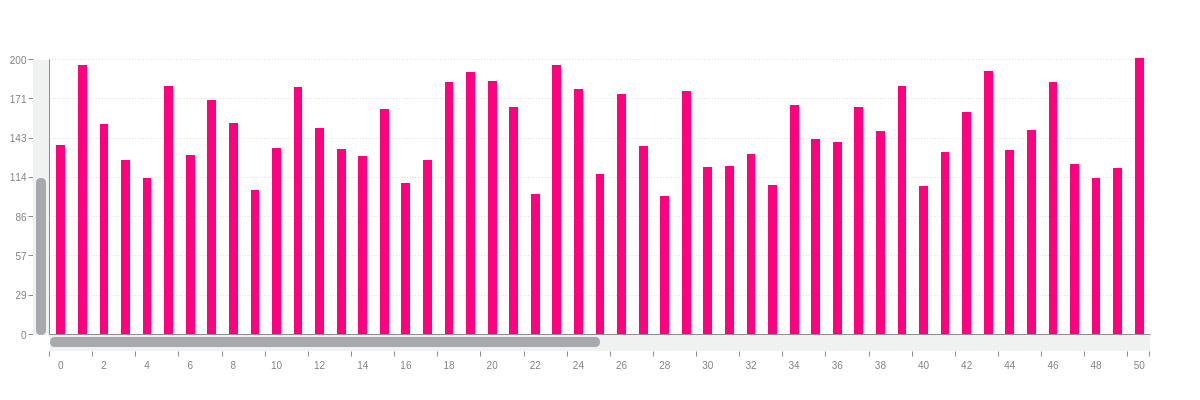
Scrollbar
The scrollbar allows users to scroll across (along the x-axis) or up-and-down (the y-axis) the chart. Scrolling can be enabled on one or both axes, and is another way to examine enlarged or specific areas of your chart.
Setup
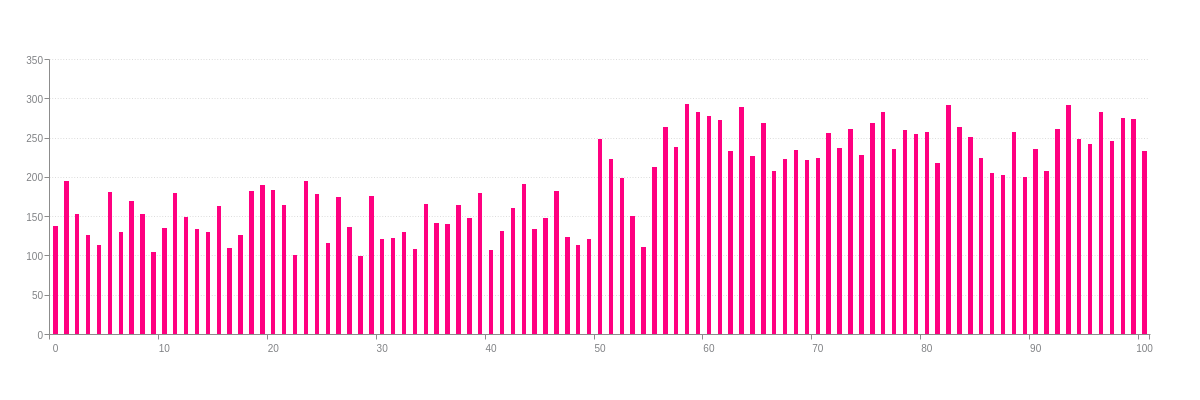
To enable scrollbar zooming on your chart, you need to first make sure the zooming attribute is set to true in the scale object(s) you want scrolling enabled. Next, create a scroll-x and/or scroll-y object(s). This will create the scrollbar. However, note that the scrollbar does not appear until you click and drag to zoom in on a section of the chart. Try it on the chart below.
{
  type: 'bar',
  'scroll-x': {

  },
  'scroll-y': {

  },
  'scale-x': {
    zooming: true,
    item: {
      'font-size':10
    }
  },
  'scale-y': {
    zooming: true,
    values: "0:350:50",
    guide: {
      'line-style': "dotted"
    },
    item: {
      'font-size':10
    }
  },
  plot: {
    'background-color': "#ff0080",
    'bar-width': "50%"
  },
  series: [
    {
      values: [
        138.2,196.3,153.6,127.4,114.1,181.4,131.1,170.9,154.4,105.2,
        136.3,180.4,150.5,135.3,130.5,164.3,110.5,127.2,183.9,191.3,
        184.8,165.7,102.4,196.2,179.1,116.8,175.2,137.8,100.9,177.3,
        122.5,123.1,131.7,109.4,167.2,142.7,140.7,165.5,148.6,181.2,
        108.7,132.9,161.9,192.1,134.5,149.4,183.9,124.4,114.4,121.7,
        249.6,224.3,199.3,151.4,112.4,213.5,265.3,239.5,294.6,284.4,
        279.2,273.7,233.7,290.1,228.2,269.3,208.4,224.6,235.1,222.5,
        225.7,257.2,238.1,262.5,229.6,269.7,283.9,236.2,260.8,255.2,
        258.1,219.5,292.4,264.8,251.7,225.9,206.5,203.3,258.2,200.7,
        237.2,208.1,262.7,292.8,249.2,242.6,284.4,246.7,275.9,274.5,
        234.2
      ]
    }
  ]
}
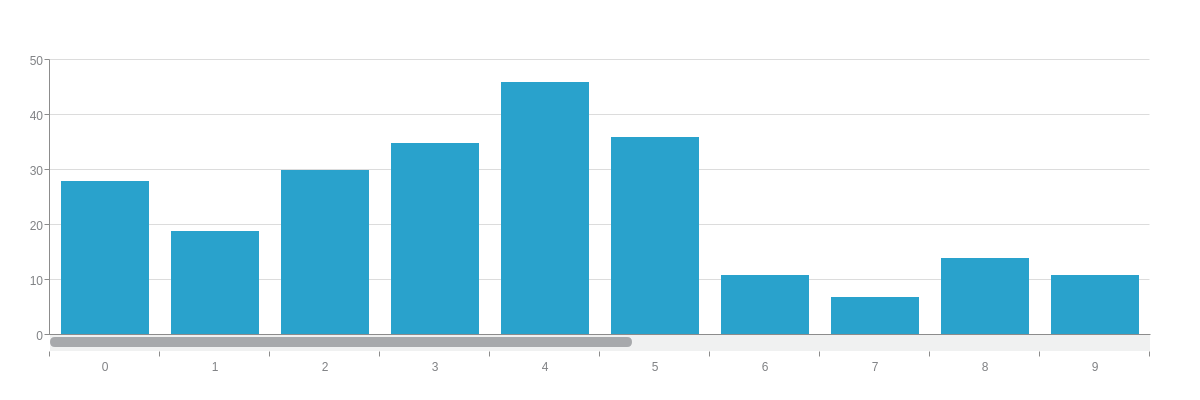
To have the scrollbar appear at chart render, you must specify the scale values you want it to start and end at with the zoom-to or zoom-to-values array. Use the former when setting values by node index (best for simple array data), and use the latter when setting values by node value (best for array of array data such as time-series).
{
  type: 'bar',
  'scroll-x': {

  },
  'scroll-y': {

  },
  'scale-x': {
    zooming: true,
    'zoom-to': [0,50],
    item: {
      'font-size':10
    }
  },
  'scale-y': {
    zooming: true,
    'zoom-to': [0,200],
    values: "0:350:50",
    guide: {
      'line-style': "dotted"
    },
    item: {
      'font-size':10
    }
  },
  plot: {
    'background-color': "#ff0080",
    'bar-width': "50%"
  },
  series: [
    {
      values: [
        138.2,196.3,153.6,127.4,114.1,181.4,131.1,170.9,154.4,105.2,
        136.3,180.4,150.5,135.3,130.5,164.3,110.5,127.2,183.9,191.3,
        184.8,165.7,102.4,196.2,179.1,116.8,175.2,137.8,100.9,177.3,
        122.5,123.1,131.7,109.4,167.2,142.7,140.7,165.5,148.6,181.2,
        108.7,132.9,161.9,192.1,134.5,149.4,183.9,124.4,114.4,121.7,
        249.6,224.3,199.3,151.4,112.4,213.5,265.3,239.5,294.6,284.4,
        279.2,273.7,233.7,290.1,228.2,269.3,208.4,224.6,235.1,222.5,
        225.7,257.2,238.1,262.5,229.6,269.7,283.9,236.2,260.8,255.2,
        258.1,219.5,292.4,264.8,251.7,225.9,206.5,203.3,258.2,200.7,
        237.2,208.1,262.7,292.8,249.2,242.6,284.4,246.7,275.9,274.5,
        234.2
      ]
    }
  ]
}
Styling
Scrollbar styling has two parts: the bar portion and the handle portion.
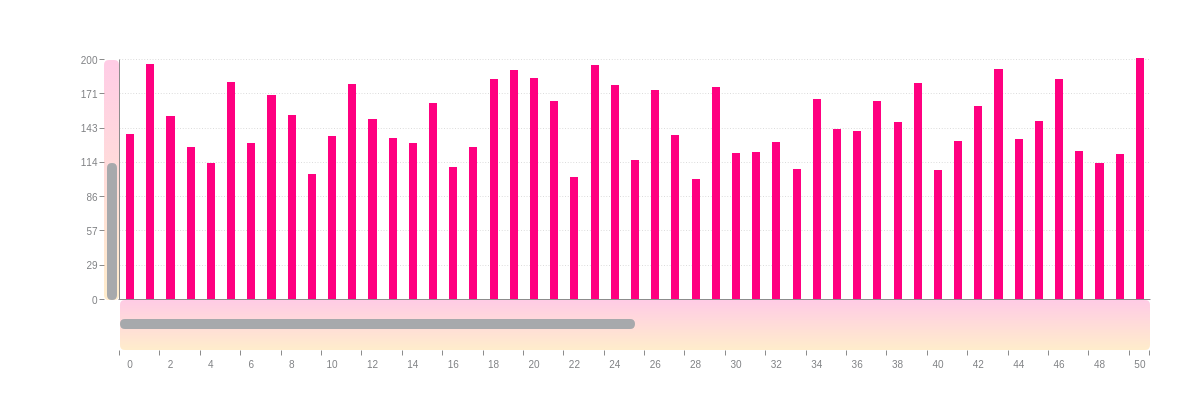
Bar
To style the bar portion of the scrollbar, create a bar object in the scroll-x and/or scroll-y object(s). Add your styling attributes. You can specify the background-color (single color or gradient), alpha transparency levels, border-radius, height (scroll-x only), and width (scroll-y only). Refer to the "bar" object JSON Attributes/Syntax page for a full list of styling attributes.
{
  type: 'bar',
  'scroll-x': {
    bar: {
      alpha:0.2,
      'background-color': "#ff0080 orange",
      'border-radius': "5px",
      height: "50px" //scroll-x only
    }
  },
  'scroll-y': {
    bar: {
      alpha:0.2,
      'background-color': "#ff0080 orange",
      'border-radius': "5px",
      width: "15px" //scroll-y only
    }
  },
  'scale-x': {
    zooming: true,
    'zoom-to': [0,50],
    item: {
      'font-size':10
    }
  },
  'scale-y': {
    zooming: true,
    'zoom-to': [0,200],
    values: "0:350:50",
    guide: {
      'line-style': "dotted"
    },
    item: {
      'font-size':10
    }
  },
  plotarea: {
    'margin-bottom': "25%",
    'margin-left': "10%"
  },
  plot: {
    'background-color': "#ff0080",
    'bar-width': "50%"
  },
  series: [
    {
      values: [
        138.2,196.3,153.6,127.4,114.1,181.4,131.1,170.9,154.4,105.2,
        136.3,180.4,150.5,135.3,130.5,164.3,110.5,127.2,183.9,191.3,
        184.8,165.7,102.4,196.2,179.1,116.8,175.2,137.8,100.9,177.3,
        122.5,123.1,131.7,109.4,167.2,142.7,140.7,165.5,148.6,181.2,
        108.7,132.9,161.9,192.1,134.5,149.4,183.9,124.4,114.4,121.7,
        249.6,224.3,199.3,151.4,112.4,213.5,265.3,239.5,294.6,284.4,
        279.2,273.7,233.7,290.1,228.2,269.3,208.4,224.6,235.1,222.5,
        225.7,257.2,238.1,262.5,229.6,269.7,283.9,236.2,260.8,255.2,
        258.1,219.5,292.4,264.8,251.7,225.9,206.5,203.3,258.2,200.7,
        237.2,208.1,262.7,292.8,249.2,242.6,284.4,246.7,275.9,274.5,
        234.2
      ]
    }
  ]
}
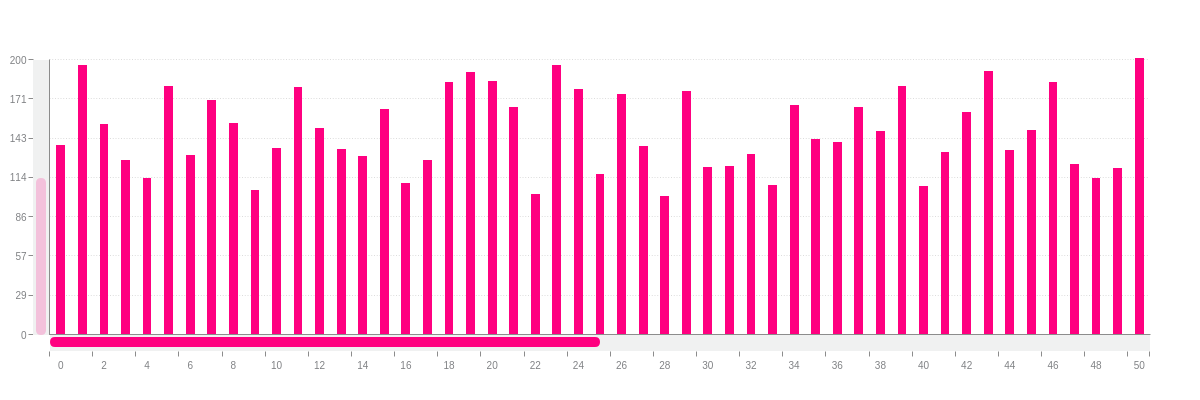
Handle
To style the handle portion of the scrollbar, create a handle object in the scroll-x and/or scroll-y object(s). Add your styling attributes. You can specify the background-color (single color or gradient), alpha transparency levels, border-radius, height (scroll-x only), and width (scroll-y only). Refer to the "handle" object JSON Attributes/Syntax page for a full list of styling attributes.
{
  type: 'bar',
  'scroll-x': {
    handle: {
      'background-color': "#ff0080",
      alpha:1,
      'border-radius': "10px",
      height: "10px" //scroll-x only
    }
  },
  'scroll-y': {
    handle: {
      'background-color': "#ff0080",
      alpha:0.2,
      'border-radius': "10px",
      height: "10px" //scroll-x only
    }
  },
  'scale-x': {
    zooming: true,
    'zoom-to': [0,50],
    item: {
      'font-size':10
    }
  },
  'scale-y': {
    zooming: true,
    'zoom-to': [0,200],
    values: "0:350:50",
    guide: {
      'line-style': "dotted"
    },
    item: {
      'font-size':10
    }
  },
  plot: {
    'background-color': "#ff0080",
    'bar-width': "50%"
  },
  series: [
    {
      values: [
        138.2,196.3,153.6,127.4,114.1,181.4,131.1,170.9,154.4,105.2,
        136.3,180.4,150.5,135.3,130.5,164.3,110.5,127.2,183.9,191.3,
        184.8,165.7,102.4,196.2,179.1,116.8,175.2,137.8,100.9,177.3,
        122.5,123.1,131.7,109.4,167.2,142.7,140.7,165.5,148.6,181.2,
        108.7,132.9,161.9,192.1,134.5,149.4,183.9,124.4,114.4,121.7,
        249.6,224.3,199.3,151.4,112.4,213.5,265.3,239.5,294.6,284.4,
        279.2,273.7,233.7,290.1,228.2,269.3,208.4,224.6,235.1,222.5,
        225.7,257.2,238.1,262.5,229.6,269.7,283.9,236.2,260.8,255.2,
        258.1,219.5,292.4,264.8,251.7,225.9,206.5,203.3,258.2,200.7,
        237.2,208.1,262.7,292.8,249.2,242.6,284.4,246.7,275.9,274.5,
        234.2
      ]
    }
  ]
}
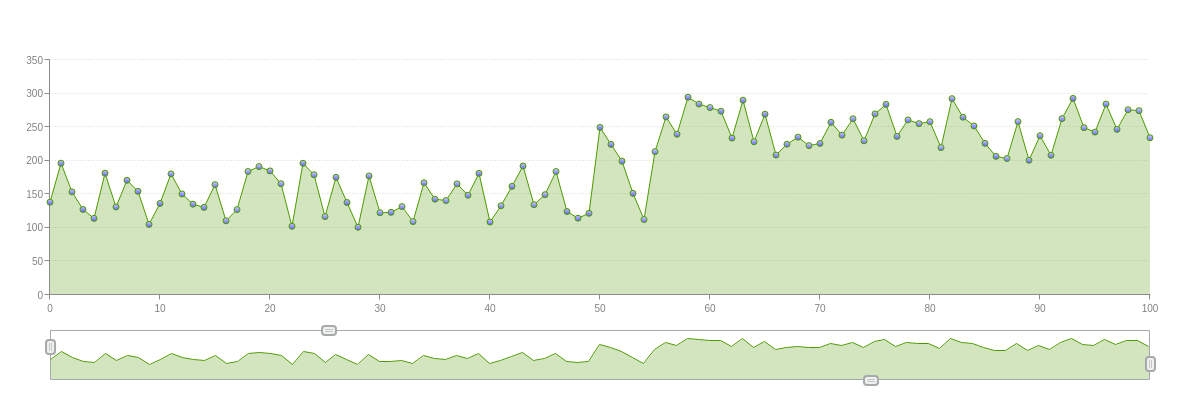
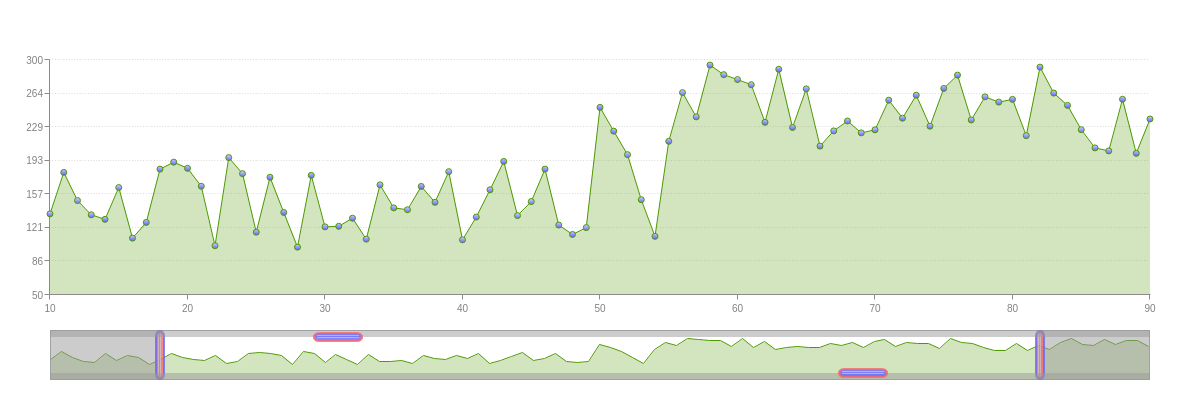
Preview Chart
The preview chart is essentially a miniaturized chart that appears below the main chart, allowing users to keep an eye on the "big picture" while zoomed in on a specific section.
Setup
To enable preview chart zooming on your chart, you need to:
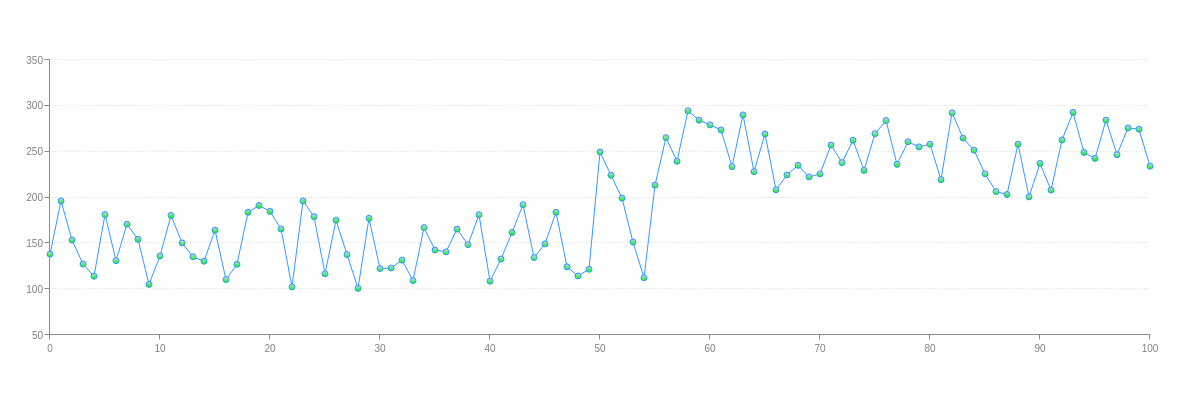
Make sure the zooming attribute is set to true in the scale object(s) you want preview zooming enabled. Next, create a preview object. This will create the preview chart, and you can use the preview handles to zoom in and out of the chart.
{
  type: "area",
  preview: {

  },
  'scale-x': {
    zooming: true,
    item: {
      'font-size':10
    }
  },
  'scale-y': {
    zooming: true,
    values: "0:350:50",
    guide: {
      'line-style': "dotted"
    },
    item: {
      'font-size':10
    }
  },
  plot: {
    'line-width':1,
    'line-color': "#4d9900",
    'background-color': "#4d9900",
    marker: {
      size:3,
      'background-color': "#ccccff #6666ff",
      'border-width': 1,
      'border-color': "#4d9900"
    },
    tooltip: {
      visible: false
    }
  },
  'crosshair-x': {
    'plot-label': {
      text: "%v"
    },
    'scale-label': {
      visible: false
    }
  },
  'crosshair-y': {
    type: "multiple",
    'scale-label': {
      visible: false
    }
  },
  series: [
    {
      values: [
        138.2,196.3,153.6,127.4,114.1,181.4,131.1,170.9,154.4,105.2,
        136.3,180.4,150.5,135.3,130.5,164.3,110.5,127.2,183.9,191.3,
        184.8,165.7,102.4,196.2,179.1,116.8,175.2,137.8,100.9,177.3,
        122.5,123.1,131.7,109.4,167.2,142.7,140.7,165.5,148.6,181.2,
        108.7,132.9,161.9,192.1,134.5,149.4,183.9,124.4,114.4,121.7,
        249.6,224.3,199.3,151.4,112.4,213.5,265.3,239.5,294.6,284.4,
        279.2,273.7,233.7,290.1,228.2,269.3,208.4,224.6,235.1,222.5,
        225.7,257.2,238.1,262.5,229.6,269.7,283.9,236.2,260.8,255.2,
        258.1,219.5,292.4,264.8,251.7,225.9,206.5,203.3,258.2,200.7,
        237.2,208.1,262.7,292.8,249.2,242.6,284.4,246.7,275.9,274.5,
        234.2
      ]
    }
  ]
}
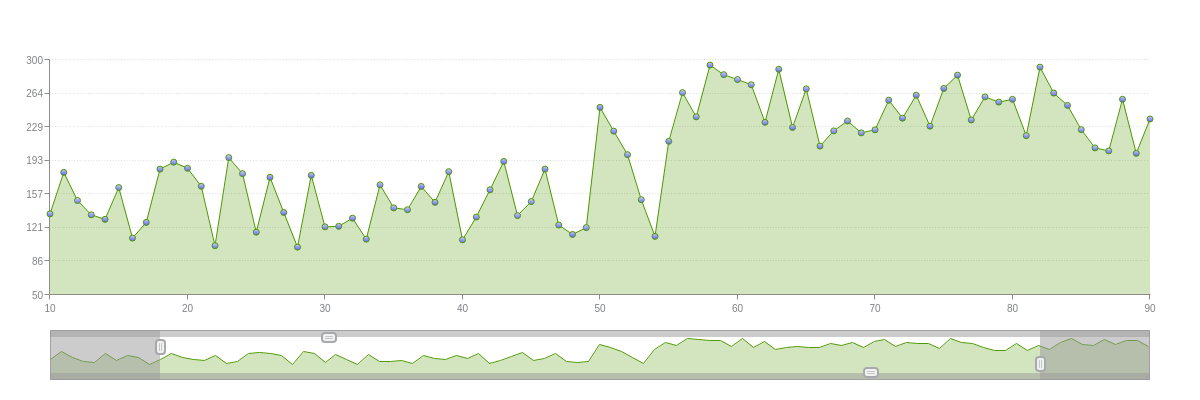
To have the chart zoom to specified scale values by default at chart render, add the zoom-to or zoom-to-values array. Use the former when setting values by node index (best for simple array data), and use the latter when setting values by node value (best for array of array data such as time-series).
{
  type: "area",
  preview: {

  },
  'scale-x': {
    zooming: true,
    'zoom-to': [10,90],
    item: {
      'font-size':10
    }
  },
  'scale-y': {
    zooming: true,
    'zoom-to': [50,300],
    values: "0:350:50",
    guide: {
      'line-style': "dotted"
    },
    item: {
      'font-size':10
    }
  },
  plot: {
    'line-width':1,
    'line-color': "#4d9900",
    'background-color': "#4d9900",
    marker: {
      size:3,
      'background-color': "#ccccff #6666ff",
      'border-width': 1,
      'border-color': "#4d9900"
    },
    tooltip: {
      visible: false
    }
  },
  'crosshair-x': {
    'plot-label': {
      text: "%v"
    },
    'scale-label': {
      visible: false
    }
  },
  'crosshair-y': {
    type: "multiple",
    'scale-label': {
      visible: false
    }
  },
  series: [
    {
      values: [
        138.2,196.3,153.6,127.4,114.1,181.4,131.1,170.9,154.4,105.2,
        136.3,180.4,150.5,135.3,130.5,164.3,110.5,127.2,183.9,191.3,
        184.8,165.7,102.4,196.2,179.1,116.8,175.2,137.8,100.9,177.3,
        122.5,123.1,131.7,109.4,167.2,142.7,140.7,165.5,148.6,181.2,
        108.7,132.9,161.9,192.1,134.5,149.4,183.9,124.4,114.4,121.7,
        249.6,224.3,199.3,151.4,112.4,213.5,265.3,239.5,294.6,284.4,
        279.2,273.7,233.7,290.1,228.2,269.3,208.4,224.6,235.1,222.5,
        225.7,257.2,238.1,262.5,229.6,269.7,283.9,236.2,260.8,255.2,
        258.1,219.5,292.4,264.8,251.7,225.9,206.5,203.3,258.2,200.7,
        237.2,208.1,262.7,292.8,249.2,242.6,284.4,246.7,275.9,274.5,
        234.2
      ]
    }
  ]
}
Styling
You can style the preview object, the active and background areas, and the preview chart handles. Currently on stock charts only, you can also style the preview chart itself.
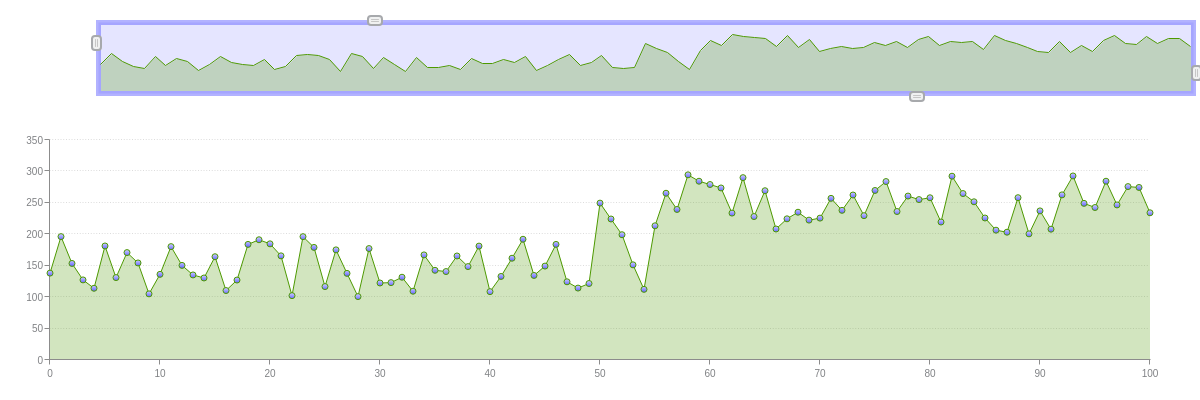
Preview Object
The preview object refers to the container that the preview chart is held in. You can style the background color and borders. You can also specify the height, width, and preview chart placement (x and y). Refer to the "preview" object JSON Attributes/Syntax page for a full list of styling attributes.
Note: This object is distinguished from the active and background areas, which are like the "live screen" and "curtain" versions over the chart. It is also distinguished from the preview chart itself, which generally cannot be modified.
{
  type: "area",
  preview: {
    alpha:0.5,
    'background-color': "#ccccff",
    'border-color': "#6666ff",
    'border-width':5,
    height: "20%",
    width: "100%",
    x: "8%",
    y: "5%"
  },
  plotarea: {
    'margin-top': "35%",
    'margin-bottom': "10%"
  },
  'scale-x': {
    zooming: true,
    item: {
      'font-size':10
    }
  },
  'scale-y': {
    zooming: true,
    values: "0:350:50",
    guide: {
      'line-style': "dotted"
    },
    item: {
      'font-size':10
    }
  },
  plot: {
    'line-width':1,
    'line-color': "#4d9900",
    'background-color': "#4d9900",
    marker: {
      size:3,
      'background-color': "#ccccff #6666ff",
      'border-width': 1,
      'border-color': "#4d9900"
    },
    tooltip: {
      visible: false
    }
  },
  'crosshair-x': {
    'plot-label': {
      text: "%v"
    },
    'scale-label': {
      visible: false
    }
  },
  'crosshair-y': {
    type: "multiple",
    'scale-label': {
      visible: false
    }
  },
  series: [
    {
      values: [
        138.2,196.3,153.6,127.4,114.1,181.4,131.1,170.9,154.4,105.2,
        136.3,180.4,150.5,135.3,130.5,164.3,110.5,127.2,183.9,191.3,
        184.8,165.7,102.4,196.2,179.1,116.8,175.2,137.8,100.9,177.3,
        122.5,123.1,131.7,109.4,167.2,142.7,140.7,165.5,148.6,181.2,
        108.7,132.9,161.9,192.1,134.5,149.4,183.9,124.4,114.4,121.7,
        249.6,224.3,199.3,151.4,112.4,213.5,265.3,239.5,294.6,284.4,
        279.2,273.7,233.7,290.1,228.2,269.3,208.4,224.6,235.1,222.5,
        225.7,257.2,238.1,262.5,229.6,269.7,283.9,236.2,260.8,255.2,
        258.1,219.5,292.4,264.8,251.7,225.9,206.5,203.3,258.2,200.7,
        237.2,208.1,262.7,292.8,249.2,242.6,284.4,246.7,275.9,274.5,
        234.2
      ]
    }
  ]
}
Chart Object
The actual preview chart can generally not be modified. The current exception is for our stock chart type: candlestick and open-high-low-close (OHLC) charts. In the plot or series object (if applicable), create a preview object. You can specify the preview chart type (area or line), line-color, background-color, alpha transparency levels, and more. Refer to the "preview" object JSON Attributes/Syntax page for more information.

{
  type: "stock",
  plot: {
    aspect: "candlestick",
    tooltip: {
      visible: false
    },
    preview: { //To style the preview chart.
      type: "area",  //"area" (default) or "line"
      'line-color': "#33ccff",
      'line-width':2,
      'line-style': "dotted",
      'background-color': "#ff3300",
      alpha:1,
      'alpha-area':0.1
    },
    'trend-up': {
      'background-color': "#33ccff",
      'border-color': "#33ccff",
      'line-color': "#33ccff"
    },
    'trend-down': {
      'background-color': "#ff3300",
      'border-color': "#ff3300",
      'line-color': "#ff3300"
    }
  },
  preview: {

  },
  'scale-x': {
    'min-value':1420232400000,
    step: "day",
    transform: {
      type: "date",
      all: "%M %d"
    },
    item: {
      'font-size':10
    },
    'max-items':9,
    zooming: true,
    'zoom-to-values': [1422910800000,1430427600000]
  },
  'scale-y': {
    values: "28:34:1",
    format: "$%v",
    item: {
      'font-size':10
    },
    guide: {
      'line-style': "dotted"
    }
  },
  'crosshair-x': {
    'plot-label': {
      text: "Open: $%open<br>High: $%high<br>Low: $%low<br>Close: $%close",
      decimals:2,
      multiple: true
    },
    'scale-label': {
      text: "%v",
      transform: {
        type: "date",
        all: "%M %d, %Y"
      }
    }
  },
  'crosshair-y': {
    type: "multiple",
    'scale-label': {
      visible: false
    }
  },
  series: [
    {
      values: [
        // Omitted for brevity.
      ]
    }
  ]
}
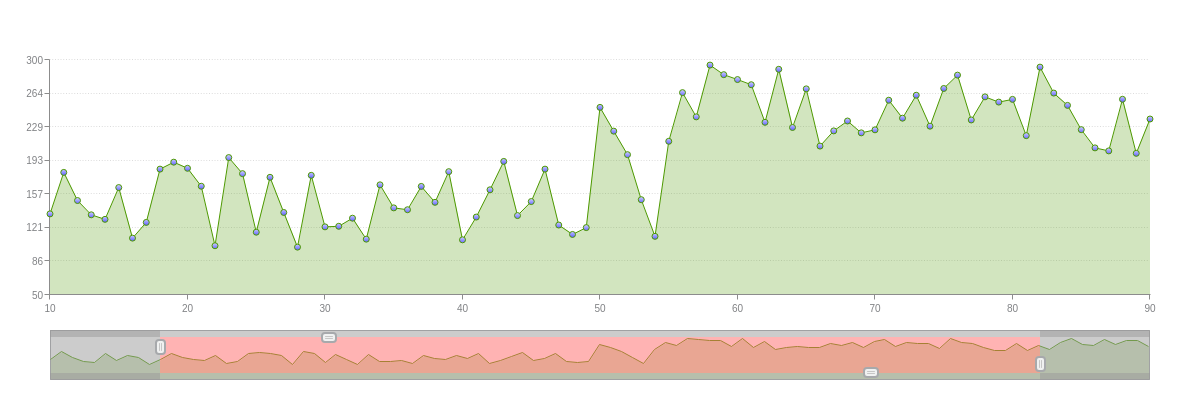
Active Area
To style the active area of the preview chart, create an active object in the preview object, and provide your attributes. You can specify the background-color and alpha transparency levels. Refer to the "active" object JSON Attributes/Syntax page for a full list of styling attributes.
{
  type: "area",
  preview: {
    active: {
      alpha:0.5,
      'background-color': "#ff6666"
    }
  },
  'scale-x': {
    zooming: true,
    'zoom-to': [10,90],
    item: {
      'font-size':10
    }
  },
  'scale-y': {
    zooming: true,
    'zoom-to': [50,300],
    values: "0:350:50",
    guide: {
      'line-style': "dotted"
    },
    item: {
      'font-size':10
    }
  },
  plot: {
    'line-width':1,
    'line-color': "#4d9900",
    'background-color': "#4d9900",
    marker: {
      size:3,
      'background-color': "#ccccff #6666ff",
      'border-width': 1,
      'border-color': "#4d9900"
    },
    tooltip: {
      visible: false
    }
  },
  'crosshair-x': {
    'plot-label': {
      text: "%v"
    },
    'scale-label': {
      visible: false
    }
  },
  'crosshair-y': {
    type: "multiple",
    'scale-label': {
      visible: false
    }
  },
  series: [
    {
      values: [
        138.2,196.3,153.6,127.4,114.1,181.4,131.1,170.9,154.4,105.2,
        136.3,180.4,150.5,135.3,130.5,164.3,110.5,127.2,183.9,191.3,
        184.8,165.7,102.4,196.2,179.1,116.8,175.2,137.8,100.9,177.3,
        122.5,123.1,131.7,109.4,167.2,142.7,140.7,165.5,148.6,181.2,
        108.7,132.9,161.9,192.1,134.5,149.4,183.9,124.4,114.4,121.7,
        249.6,224.3,199.3,151.4,112.4,213.5,265.3,239.5,294.6,284.4,
        279.2,273.7,233.7,290.1,228.2,269.3,208.4,224.6,235.1,222.5,
        225.7,257.2,238.1,262.5,229.6,269.7,283.9,236.2,260.8,255.2,
        258.1,219.5,292.4,264.8,251.7,225.9,206.5,203.3,258.2,200.7,
        237.2,208.1,262.7,292.8,249.2,242.6,284.4,246.7,275.9,274.5,
        234.2
      ]
    }
  ]
}
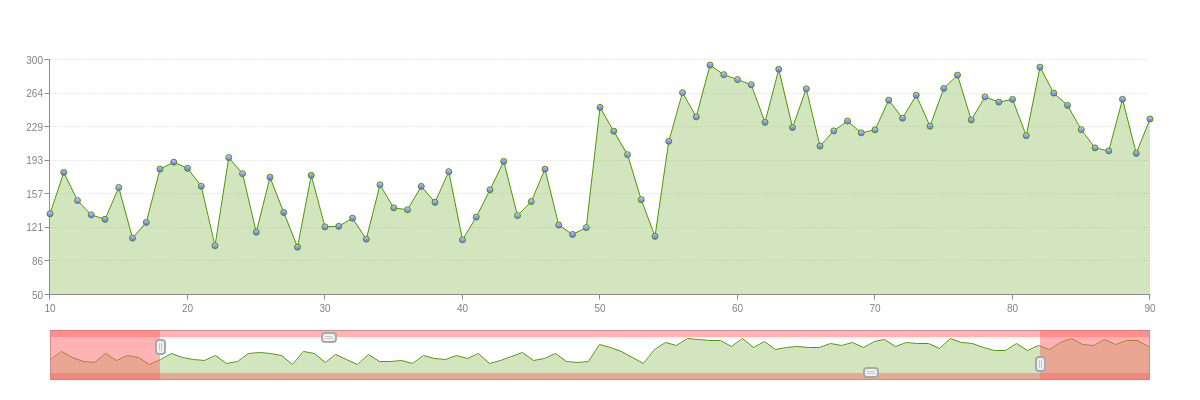
Background Area
To style the background area of the preview chart, create a mask object in the preview object, and provide your attributes. You can specify the background-color and alpha transparency levels. Refer to the "mask" object JSON Attributes/Syntax page for a full list of styling attributes.
{
  type: "area",
  preview: {
    mask: {
      alpha:0.5,
      'background-color': "#ff6666"
    }
  },
  'scale-x': {
    zooming: true,
    'zoom-to': [10,90],
    item: {
      'font-size':10
    }
  },
  'scale-y': {
    zooming: true,
    'zoom-to': [50,300],
    values: "0:350:50",
    guide: {
      'line-style': "dotted"
    },
    item: {
      'font-size':10
    }
  },
  plot: {
    'line-width':1,
    'line-color': "#4d9900",
    'background-color': "#4d9900",
    marker: {
      size:3,
      'background-color': "#ccccff #6666ff",
      'border-width': 1,
      'border-color': "#4d9900"
    },
    tooltip: {
      visible: false
    }
  },
  'crosshair-x': {
    'plot-label': {
      text: "%v"
    },
    'scale-label': {
      visible: false
    }
  },
  'crosshair-y': {
    type: "multiple",
    'scale-label': {
      visible: false
    }
  },
  series: [
    {
      values: [
        138.2,196.3,153.6,127.4,114.1,181.4,131.1,170.9,154.4,105.2,
        136.3,180.4,150.5,135.3,130.5,164.3,110.5,127.2,183.9,191.3,
        184.8,165.7,102.4,196.2,179.1,116.8,175.2,137.8,100.9,177.3,
        122.5,123.1,131.7,109.4,167.2,142.7,140.7,165.5,148.6,181.2,
        108.7,132.9,161.9,192.1,134.5,149.4,183.9,124.4,114.4,121.7,
        249.6,224.3,199.3,151.4,112.4,213.5,265.3,239.5,294.6,284.4,
        279.2,273.7,233.7,290.1,228.2,269.3,208.4,224.6,235.1,222.5,
        225.7,257.2,238.1,262.5,229.6,269.7,283.9,236.2,260.8,255.2,
        258.1,219.5,292.4,264.8,251.7,225.9,206.5,203.3,258.2,200.7,
        237.2,208.1,262.7,292.8,249.2,242.6,284.4,246.7,275.9,274.5,
        234.2
      ]
    }
  ]
}
Handles
To style the preview chart handles, you can apply the same styling to all of them with the handle object. Alternatively, you can style each handle individually with the handle-left, handle-right, handle-top, and handle-bottom objects. Add the desired handle objects into the preview object, and provide your styling attributes. You can specify the background-color, border-color, border-radius, border-width, alpha transparency levels, height, and width.
Refer to the Handle JSON Attributes/Syntax page for a full list of attribute options.
{
  type: "area",
  preview: {
    'handle-left': {
      'background-color': "#ff6666",
      'border-color': "#6666ff",
      alpha:0.8,
      'border-radius': "15px",
      'border-width':2,
      height: "50px",
      width: "10px"
    },
    'handle-right': {
      'background-color': "#ff6666",
      'border-color': "#6666ff",
      alpha:0.8,
      'border-radius': "15px",
      'border-width':2,
      height: "50px",
      width: "10px"
    },
    'handle-top': {
      'background-color': "#6666ff",
      'border-color': "#ff6666",
      alpha:0.8,
      'border-radius': "15px",
      'border-width':2,
      height: "10px",
      width: "50px"
    },
    'handle-bottom': {
      'background-color': "#6666ff",
      'border-color': "#ff6666",
      alpha:0.8,
      'border-radius': "15px",
      'border-width':2,
      height: "10px",
      width: "50px"
    }
  },
  'scale-x': {
    zooming: true,
    'zoom-to': [10,90],
    item: {
      'font-size':10
    }
  },
  'scale-y': {
    zooming: true,
    'zoom-to': [50,300],
    values: "0:350:50",
    guide: {
      'line-style': "dotted"
    },
    item: {
      'font-size':10
    }
  },
  plot: {
    'line-width':1,
    'line-color': "#4d9900",
    'background-color': "#4d9900",
    marker: {
      size:3,
      'background-color': "#ccccff #6666ff",
      'border-width': 1,
      'border-color': "#4d9900"
    },
    tooltip: {
      visible: false
    }
  },
  'crosshair-x': {
    'plot-label': {
      text: "%v"
    },
    'scale-label': {
      visible: false
    }
  },
  'crosshair-y': {
    type: "multiple",
    'scale-label': {
      visible: false
    }
  },
  series: [
    {
      values: [
        138.2,196.3,153.6,127.4,114.1,181.4,131.1,170.9,154.4,105.2,
        136.3,180.4,150.5,135.3,130.5,164.3,110.5,127.2,183.9,191.3,
        184.8,165.7,102.4,196.2,179.1,116.8,175.2,137.8,100.9,177.3,
        122.5,123.1,131.7,109.4,167.2,142.7,140.7,165.5,148.6,181.2,
        108.7,132.9,161.9,192.1,134.5,149.4,183.9,124.4,114.4,121.7,
        249.6,224.3,199.3,151.4,112.4,213.5,265.3,239.5,294.6,284.4,
        279.2,273.7,233.7,290.1,228.2,269.3,208.4,224.6,235.1,222.5,
        225.7,257.2,238.1,262.5,229.6,269.7,283.9,236.2,260.8,255.2,
        258.1,219.5,292.4,264.8,251.7,225.9,206.5,203.3,258.2,200.7,
        237.2,208.1,262.7,292.8,249.2,242.6,284.4,246.7,275.9,274.5,
        234.2
      ]
    }
  ]
}
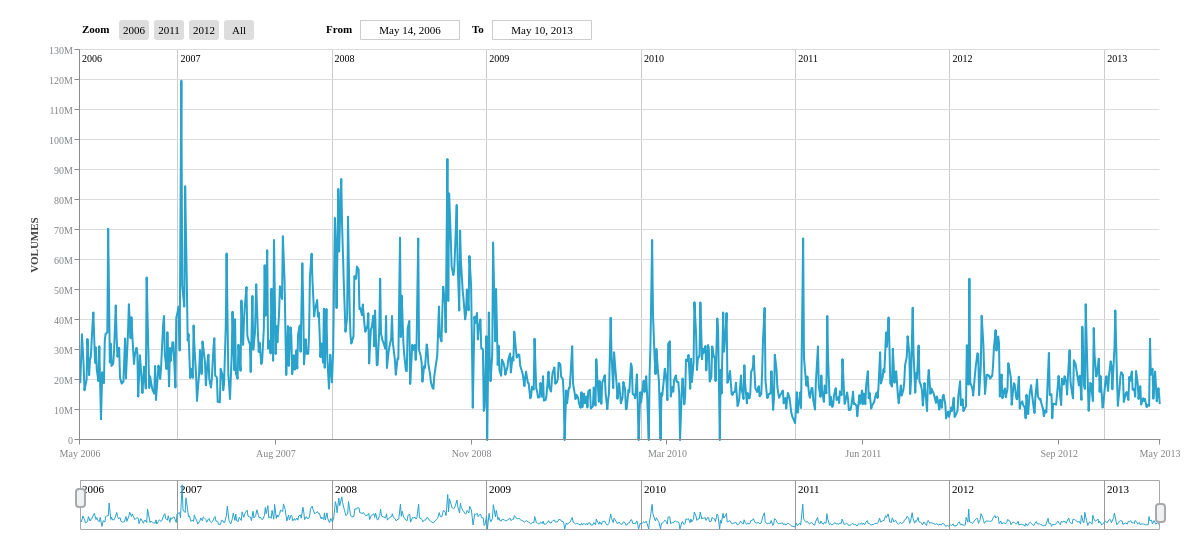
Zoom Buttons Module
Use the "zoom-button" module to define custom buttons that zooms to specified area of the chart.
The array of objects, buttons, accepts the following attributes:
text: Text to display on buttontype: The multiplier forcountcount: Zoom offset
options: {
    buttons : [
        {
            text : '2006',
            type : 'year',
            count : 2013-2010
        },
        {
            text : '2011',
            type : 'year',
            count : 2013-2011
        },
        {
            text : '2012',
            type : 'year',
            count : 2013-2012
        },
        {
            text : 'All',
            type : 'all',
        },
    ]
},
Summary
For a full list of attributes, see the JSON configurations for: