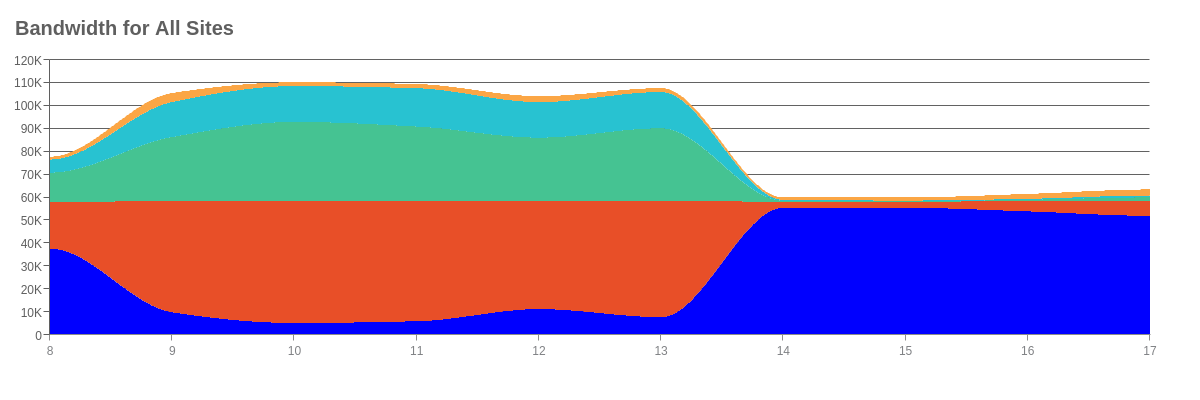
Stream Graph
Overview
ZingChart supports two stream chart types:
- Horizontal(Default)
- Vertical
Render Plugin
Stream graphs require you to put the zingchart.render method inside of the plugin callback. This will dynamically fetch the plugin and render the grid.
// load module stream and in callback success of that
// module loading, render the chart
zingchart.loadModules('stream', function() {
  zingchart.render({
  	id : 'myChart',
  	data : myConfig,
  	height: 400,
  	width: '100%'
	});
});
Note: You can also load the plugin manually by using the HTML or JavaScript referenced below. If you load the plugin manually, you DO NOT have to use the loadModules method as a wrapper for your render function.
HTML
<script src="https://cdn.zingchart.com/modules/zingchart-stream.min.js"></script>
JavaScript
import {zingchart, ZC} from 'zingchart/es6';
// to import the stream chart module
import 'zingchart/modules-es6/zingchart-stream.min.js';
Type
Use the type="stream" or type="vstream" attribute in your chart object to define horizontal or vertical streams, respectively.
{
	type: 'stream', // vstream will present a vertical stream
}
Data
To enter data into the stream chart, use the series array. Each object in the series array requires a values array to function properly. You'll also need to add a values array to the scaleX object if you are entering data as a single dimensional array. You can enter in data as a single dimensional array or a two dimensional [timestamp, value] array.
Note: Learn more about the series array with our series JSON Configuration page.
1D
For a single dimensional array, define your x-values with a values array inside the scaleX object. Define your corresponding y-values with a values array inside the series object.
{
	"scaleX":
		{
			"values":[1442905200000,1442908800000,1442912400000,1442916000000,1442919600000,1442923200000,1442926800000,1442930400000,1442934000000,1442937600000,1442941200000,1442944800000,1442948400000],
		},
	"series":[
		{
			"values":[2596,2626,4480,6394,7488,14510,7012,3389,20281,48597,53309,52385,47097,50813,13510],
		},
	]
}
2D
For a two dimensional array, you can plot the data all within the values array in a [x,y] format.
{
	"series":[
		{
			"values": [
				[1442905200000,2596],
				[1442908800000,2626],
				[1442912400000,4480],
				[1442916000000,6394]
			],
		},
	]
}
Feed
Stream graphs can be hooked up to feed stream data into the chart. This is the intended purpose for stream graphs. The object format you should pass to the chart should look like this:
Note: For more information on hooking your chart up to real-time data, refer to our Real-Time Feeds Tutorial.
{
	plot0: null,  // insert a null value to create space
	plot1: 3, // first plot
	plot2: 18, // second plot
	// optional label format or unix millisecond timestamp (for both	plots)
	scaleX: 1442908800000 // or label - "13:33:48"
}
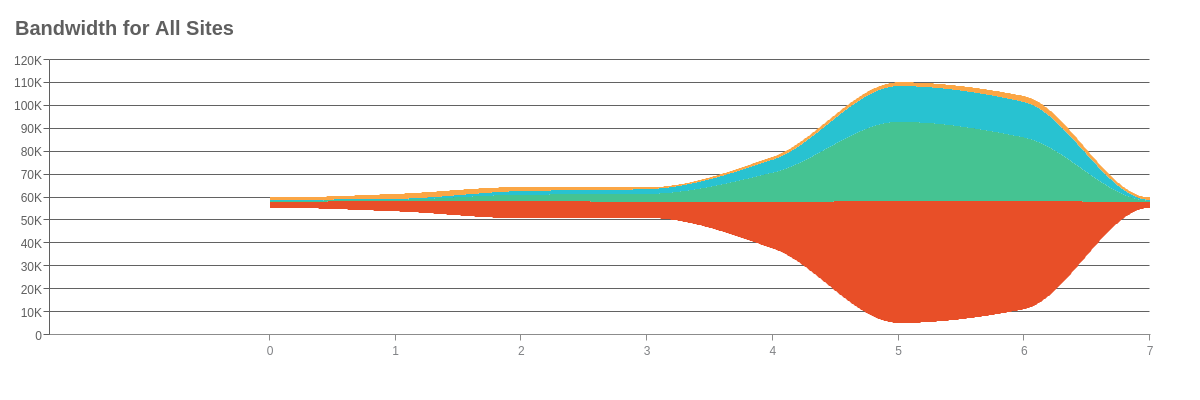
Chart-Specific Properties
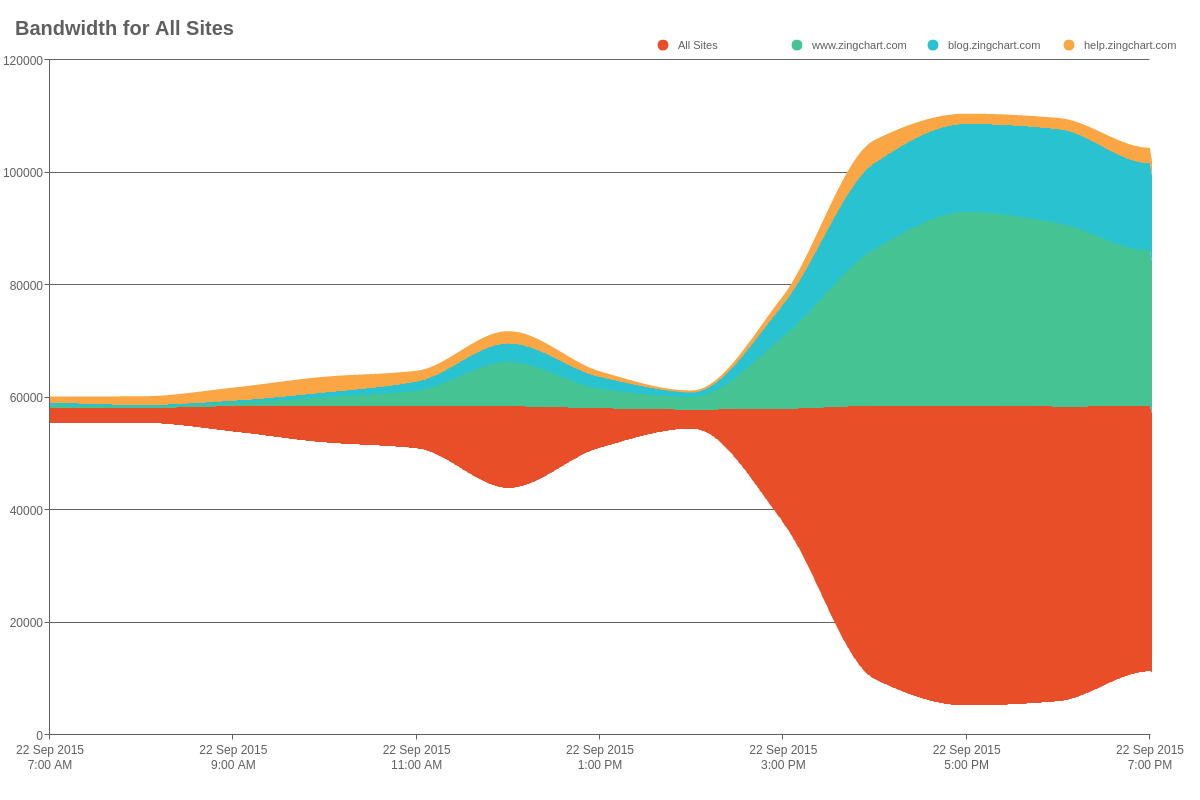
Empty Series
Use the emptySeries to style the empty series data auto-generated by the plugin and placed under series.
{
	options: {
		emptySeries: {
			backgroundColor: 'blue',
		},
	}
}