Depth Chart
Depth Chart Type
ZingChart depth charts use the type attribute. In your chart object, add a type attribute and set the value to depth.
{
	type: 'depth'
}
Data
To enter data into the depth chart, use the series array. Each object in the series array requires a values array to function properly.
Note: Learn more about the series array with our series JSON Configuration page.
{ //shortened for brevity- click following depth chart demo to view full configuration
	series: [
		{
			values: [
				[1168.49, 0],
				[1164.69, 12.0211],
				[1163.38, 33.0049],
            ],
			text: 'Sell'
		},
		{
			values: [
				[1168.49, 0],
				[1172.22, 33.1932],
				[1174.28, 50.5177],
            ],
			text: 'Buy'
		}
	]
}
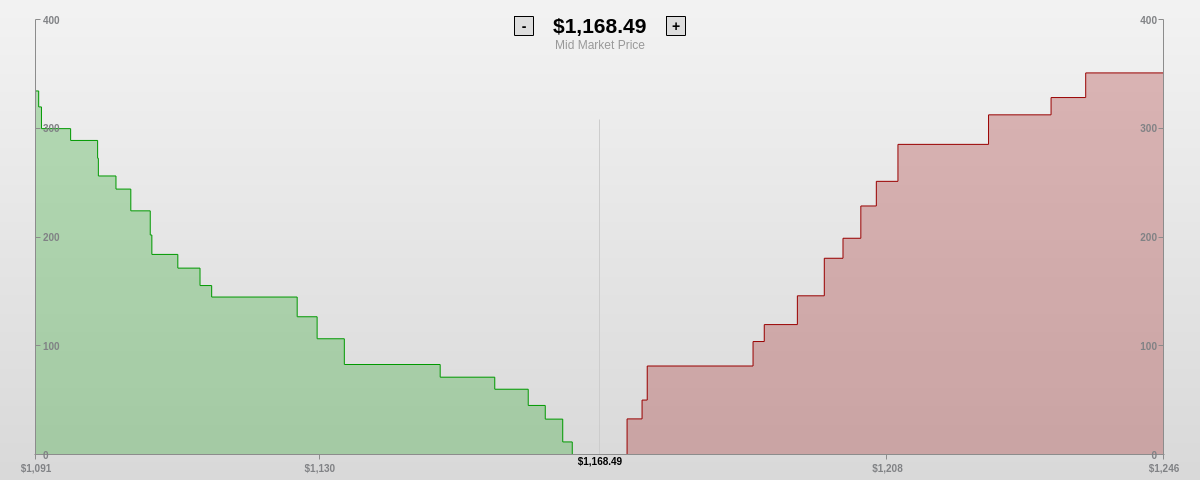
Chart-Specific Properties
Configure your depth chart's currency symbol, title and subtitle, and mid-market price marker with the options object.
Currency
The currency attribute sets the character to precede monetary values with. Add any unicode currency symbol as a value. By default, the symbol displays as "$".
{
	"options":{
		"currency" : "£"
    }
}
Title and Subtitle
Style your depth chart's title with a title object. By default, the title displays the mid-market price value. To change this, add a text attribute with your your new title as its value.
To style the subtitle, use the subtitle object. By default, the subtitle displays: "Mid Market Price". To change this, add a text attribute with your your new subtitle as its value. To change the visibility of the subtitle, add a visible attribute with a value of true or false. The default is true.
{
	options: {
		title: {
		color: '#ffff00'
		//text: "title"
		},
		subtitle: {
			visible: false
			//text: "subtitle"
      },
	}
}
Mid Market Price Marker
Use the mmpMarker object to configure your mid-market price marker. By default, the marker label displays the mid market price value. To change this, add a text attribute with your your new label as its value.
Note: Learn more about markers and how to style them with our Markers Tutorial.
{
	options: {
		mmpMarker: {
			alpha: 0.75,
			lineColor: '#999',
			label: {
				color: '#fff',
				fontSize: 15,
				offsetY: 20
			}
		}
	}
}
Zoom Buttons
Use the buttonZoomin and buttonZoomout objects to configure the zoom-in and zoom-out buttons.
Note: For more configuration and styling options, browse our JSON Attributes/Syntax page.
{
	options: {
		buttonZoomin: {
			borderColor: 'red',
      borderWidth: 4,
		}
	}
}
Further Customization
You can also use the options object to style your chart.
Palette
The palette attribute defines a custom palette for the highest and lowest buy prices, respectively . Provide a string of two comma separated color, HEX, or RGB values. The first value represents the high buy prices and the second value represents the low buy prices.
{
  options: {
    palette: ['#69f0ae', '#e040fb'] //['high price color, low price color']
  }
}