Tree Charts
Note: See our Tree Module Gallery for inspiration on all the different tree chart possibilities.
Tree Chart Type
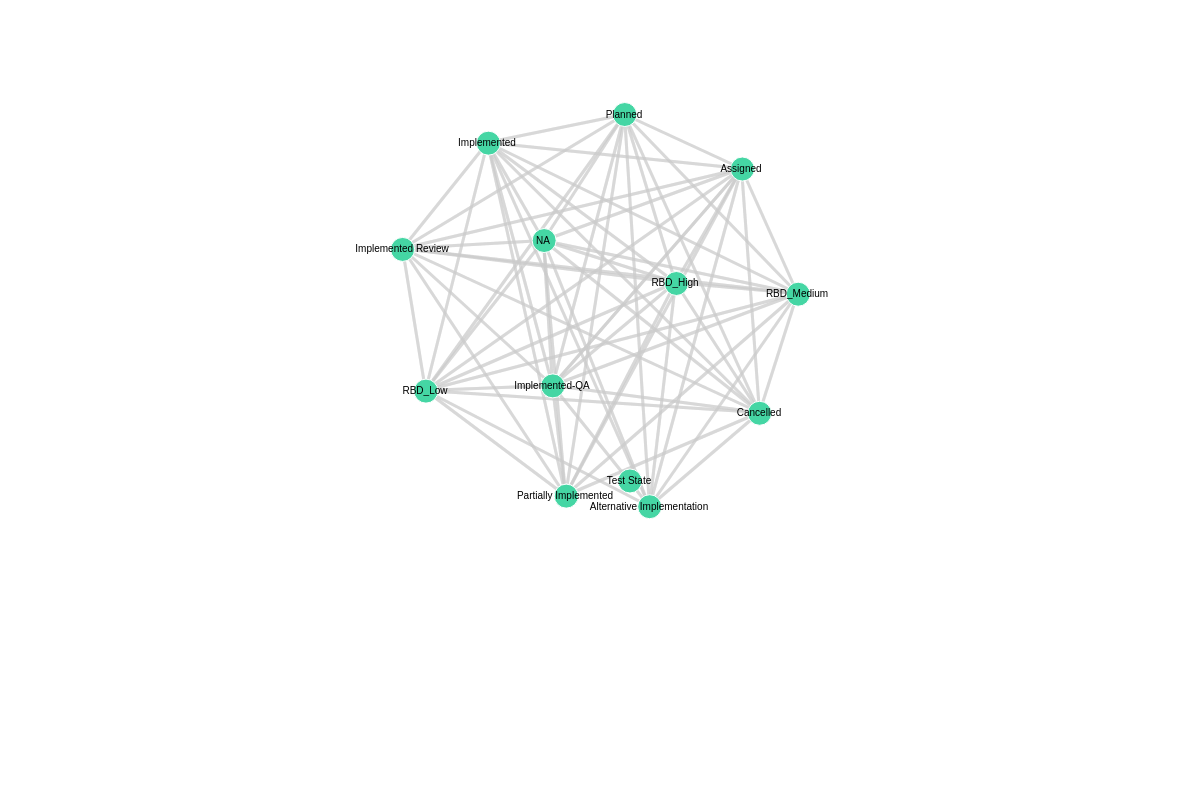
To specify the chart type, add a type attribute to the chart object. Our standard tree chart (aka network diagram) is specified by the tree value.
{
  type: 'tree'
}
Graph Tree Chart
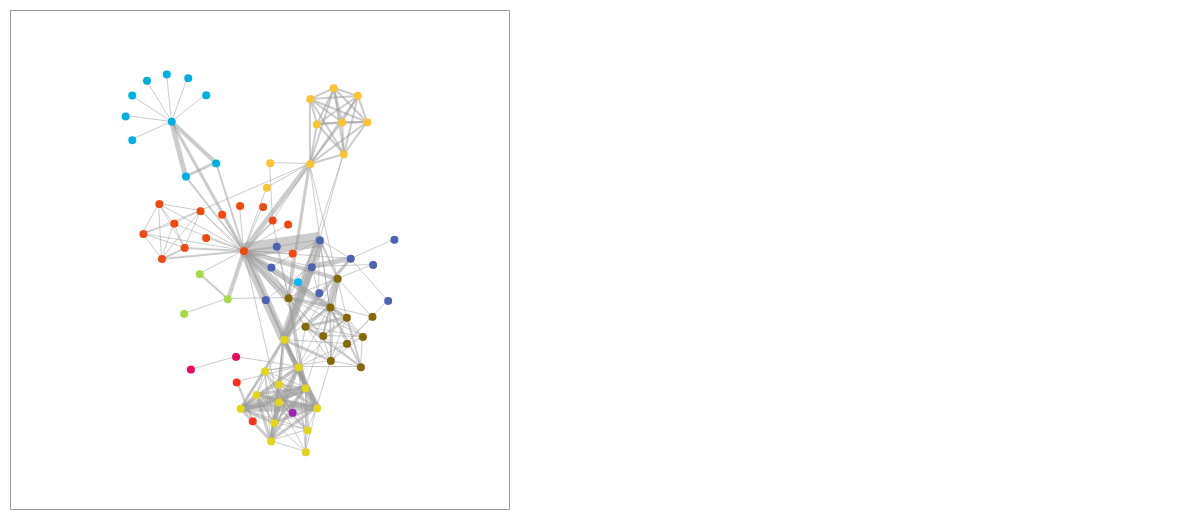
To create a graph tree chart, set aspect: 'graph in the options object. Graph tree charts have a specific way of entering and linking node data.
Data Format
Tree-module charts support data in the form of a series array of objects. Each object in the series array represents nodes or links.
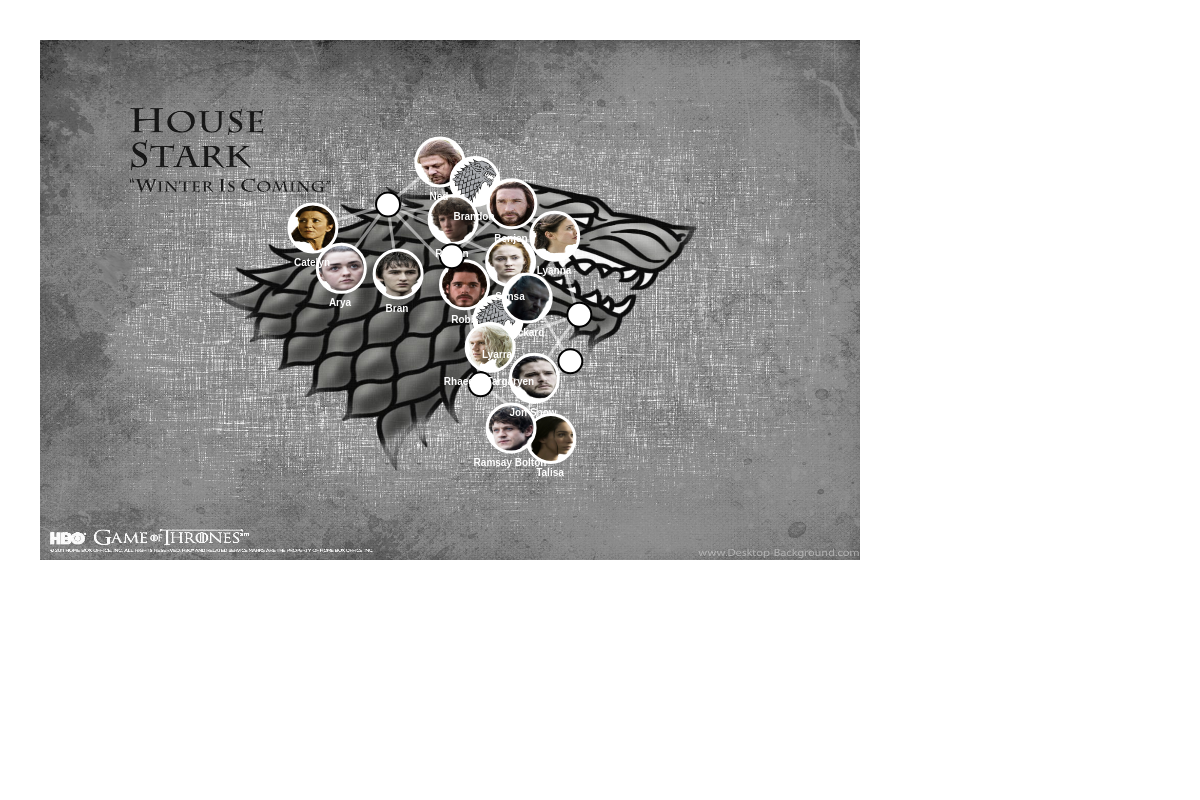
Family Nodes
For this type of tree chart, there will be a main node (family node) object that will link to other nodes that will contain the information, such as the images. Family node objects will have a few attributes needed for it to work. First, you'll need to add the type attribute with a value of 'node' to your series array, meaning each series will be a floating node.
Each object will also need the id attribute. This main node holds the family trees together and will be called n1, n2, n3 and so forth.
Note: You can include an optional cls attribute to set a class on the object for styling (discussed further below).
A standard family node will take this format:
{
  type: 'node',
  id: 'n1',
  cls : 'fam', //optional class for styling
  text: '', //optional text for label- empty string value for family nodes
  dataFullname: '' //optional custom token- empty string value for family nodes
}
With each new family or group on the graph tree charts, we need to have a new hub node so that the families will have their own hub to link to (the id values of n1, n2 and so forth). The best way to organize these for ease of reading and use would be to have the main hub series above the same family series that will be tied to that hub. An example is:
{
  series: [
    { // main node hub 1
      type: 'node',
      id: 'n1',
      cls: 'fam',
      text: ' ',
      dataFullName: ''
    },
    {
      type: 'node',
      id: 'Ned Stark',
    },
    {
      type: 'node',
      id: 'Brandon Stark',
      text: 'Brandon',
      dataFullName: 'Brandon Stark',
    },
    { // main node hub 2
      type: 'node',
      id: 'n2',
      cls: 'fam',
      text: ' ',
      dataFullName: ''
    },
    {
      type: 'node',
      id: 'Lyarra Stark',
    },
  ]
}
Data Nodes
With each main node hub, we can link other data objects to it. The data node objects will have a few attributes that we need to fill out, the first being type: 'node'. Furthermore, we need to assign an id to this object so that we can target and link it to the hub nodes. The id attribute for data nodes can be assigned anything and will most likely describe what the data node represents.
Adding a text attribute will give your node a label. dataFullname is a custom token that can be used to display more information in your tooltips. For family node objects, these attributes take empty strings as values.
Note: You can include an optional cls attribute to set a class on the object for styling (discussed further below).
A standard data node will take this format:
{
  series: [
    { //data node object
      type: 'node',
      id: 'Ned Stark',
      text: 'Ned',
      dataFullName: 'Ned Stark',
    },
  ]
}
Link Objects
Once we have our families and data nodes set, we can link them together using link objects in the same series array. First, you'll need the type attribute with a value of 'link'.
Link objects will target the id attribute and draw a link from the source value to the target value. In our case, the source will be the main node hubs of n1, n2 and n3, and the target will be the id of data nodes.
Every data node will need a link object so that it will be connected to the chosen hub node. A data node can be linked to multiple family trees by linking them to multiple hub nodes.
{
  series:[
    {
      type: 'link',
      source: 'n1',
      target: 'Ned Stark'
    },
  ]
}
Link-Node Attraction and Interactions
For graph tree charts, the springLength, attractionConstant, repulsionConstant, and repulsionDistanceFactor attributes will determine the length, repulsion, attraction and interactions of the links and nodes.
The attractionConstant and repulsionConstant attributes are used to determine the amount of magnetization between each node in a graph tree chart . The constants used in the Game of Thrones demo gives the graph tree chart a balanced amount of distance and attraction:
{
  options: {
    aspect: 'graph',
    springLength: 75,
    attractionConstant: 0.8,
    repulsionConstant: 4000,
    repulsionDistanceFactor: 20,
  }
}
Node Styling
To style individual nodes, create a style object within the applicable series object. This is where we will be able to set the backgroundImage, size and many other ZingChart styling basics for the nodes.
Note: When using backgroundImage, it is useful to use background-fit: 'xy' so that the image will be centered and show properly inside the small node area.
Note: Learn more about styling nodes with our Chart Plot & Series Styling Tutorial.
{
  series: [
    {
      type: 'node',
      style: {
        "background-fit": "xy",
        backgroundImage: "https://i.imgur.com/OFrvsvv.png"
      }
    },
  ]
}
To style hub nodes, use the node[cls-fam] object inside the options object. node[cls-fam] can take the same attributes as the node objects except that it will target the hub nodes instead of the data nodes. The cls-fam nomenclature stems from how we set the series array in the tree chart.
{
  options: {
    'node[cls-fam]': {
      size: 12,
      borderWidth: 2,
      borderColor: '#000',
      backgroundColor: 'white',
      label: {
        visible: false
      }
    },
  }
}
Chart-Specific Properties
Use the options object to configure the tree-module.
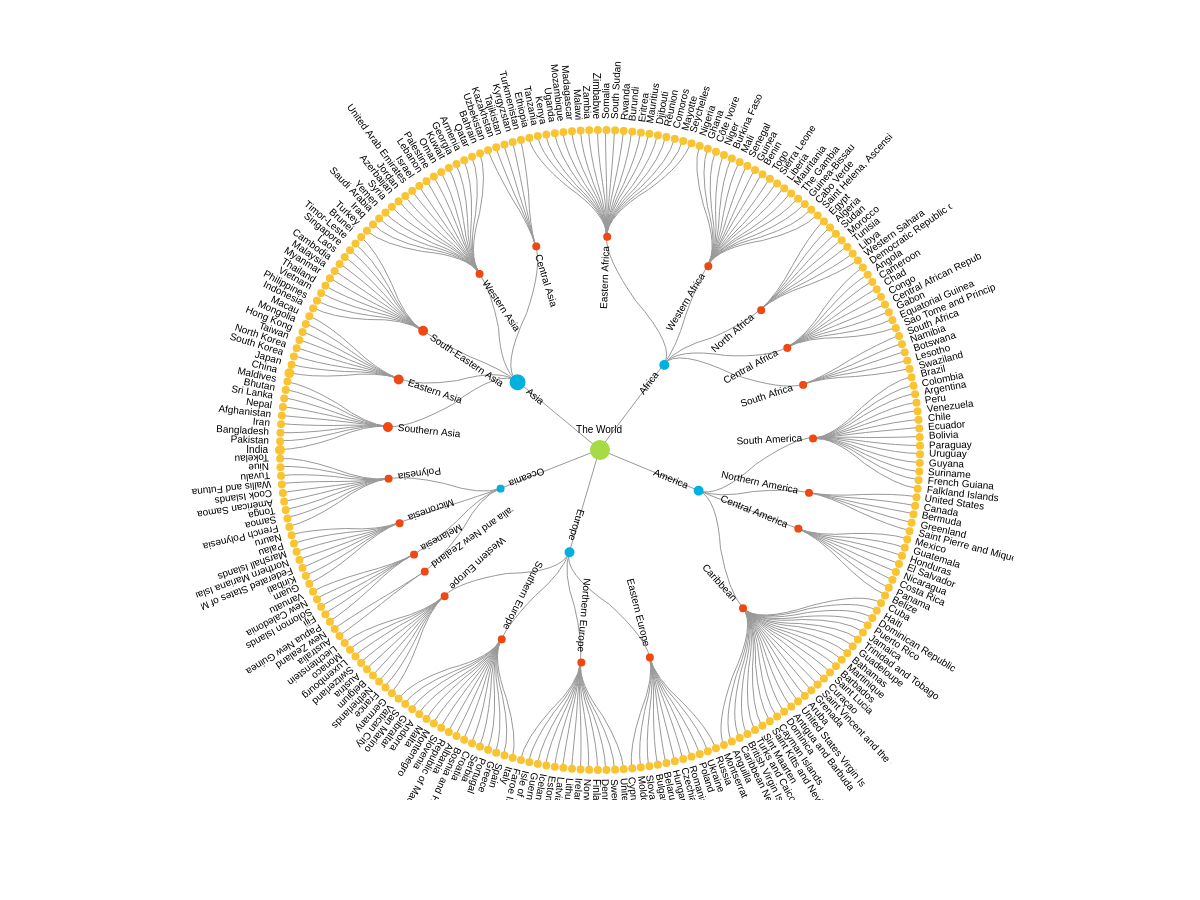
Aperture
Sets the total radial aperture for the radial trees.
{
  type: 'tree',
  options: {
    aspect: 'tree-radial',
    aperture: 100,
  },
}
Damping Step
Sets the damping factor for each step of the force directed graph iteration. The default value is 0.005. Higher values will force the graph to stop faster, with the cost of not reaching an optimal state for the layout.
{
  type: 'tree',
  options: {
    dampingStep: 0.05,
  },
}
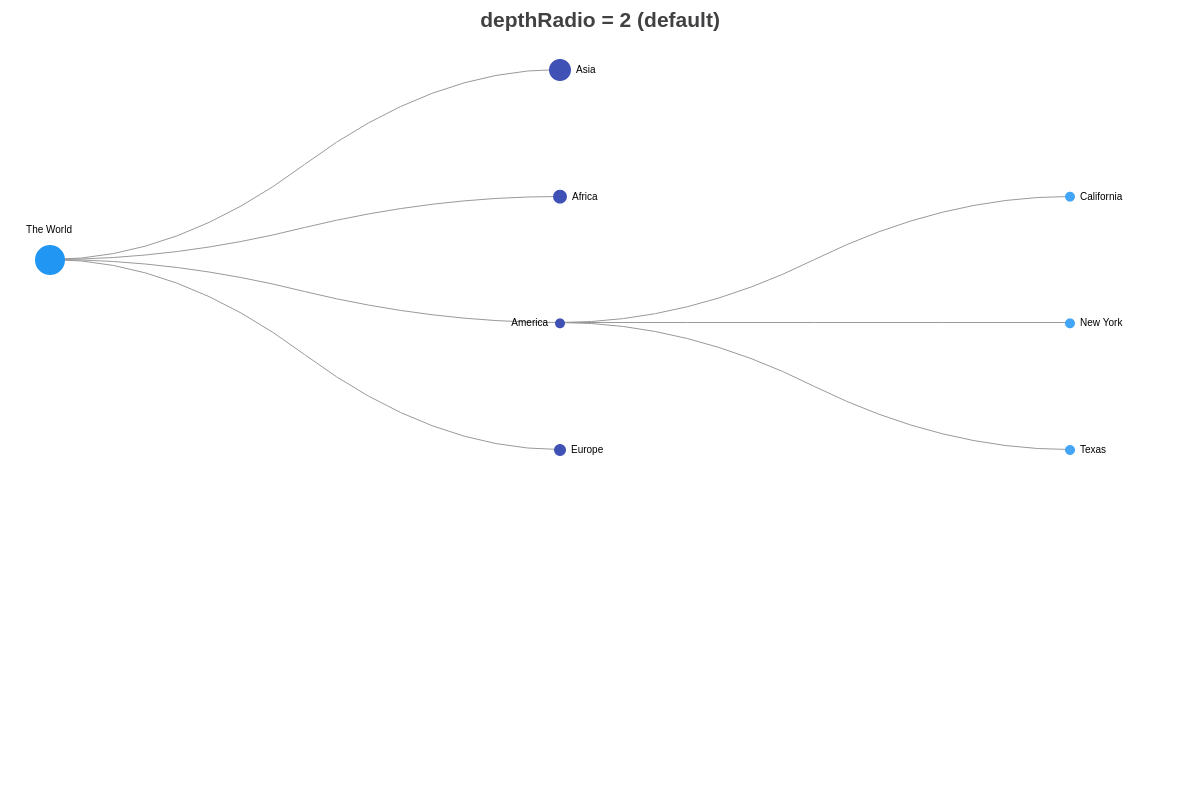
Depth Ratio
Sets a ratio for the curvature of the links. Note that this only applies with links are curved.
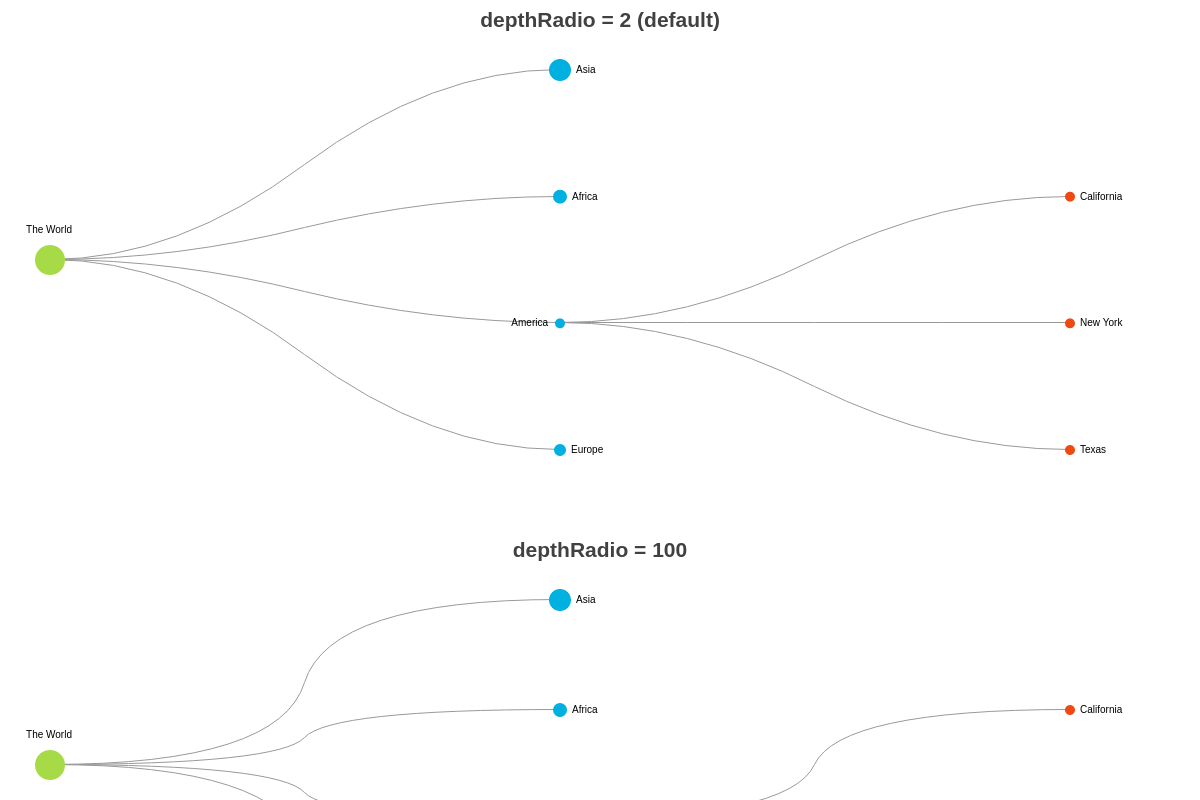
{
  type: 'tree',
  options: {
    depthRatio: 10,
    link: {
      aspect: 'arc'
    },
  },
}
Fake
Sets the node as a branch point for other nodes to branch off from.
{
  type: 'tree',
  series: [
    {
      id: 'fake1',
      fake: true,
      name: '1',
      parent: 'parent',
    },
    ...
  ],
}
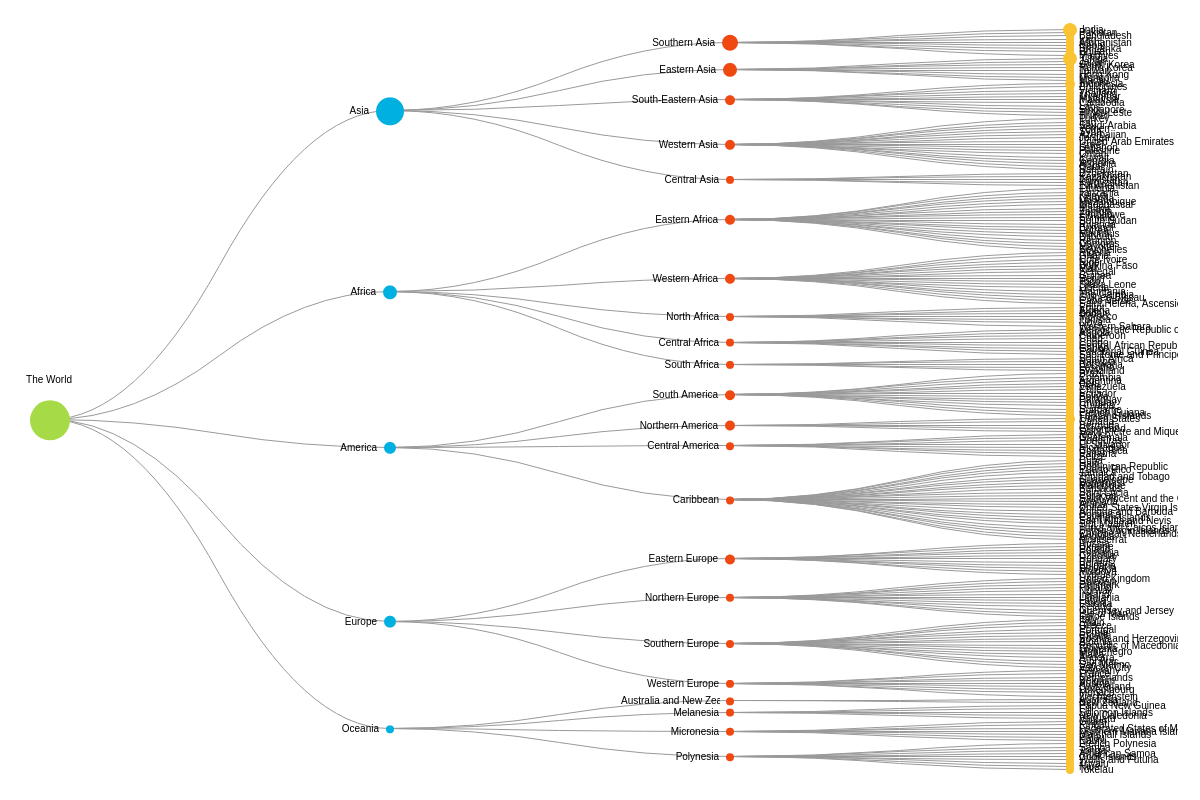
Layout
Sets the layout to use when there are multiple top-level parent nodes present.
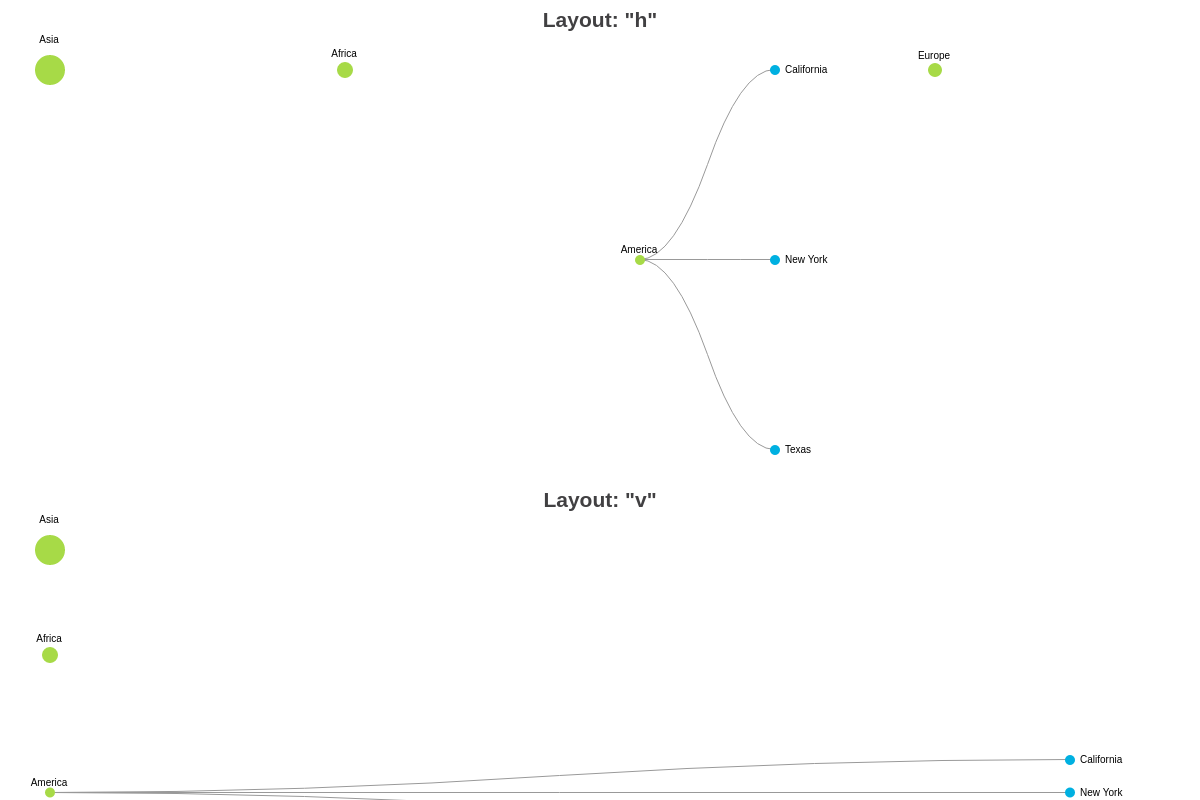
{
  type: 'tree',
  options: {
    layout: 'h',
  },
}
Max Iteration
Sets the max number of iterations executed before stabilizing the force directed graph.
{
  type: 'tree',
  options: {
    aspect: 'graph',
    maxIterations: 20,
  },
}
Max Link Width
Sets the max width for the links between nodes (available in the force directed graphs).
{
  type: 'tree',
  options: {
    maxLinkWidth: 15, // default is 5
  },
}
Minimum and maximum Size
Sets the minimum and maximum size for nodes.
{
  type: 'tree',
  options: {
    minSize: 4,
    maxSize: 20, // default is 4
  },
}
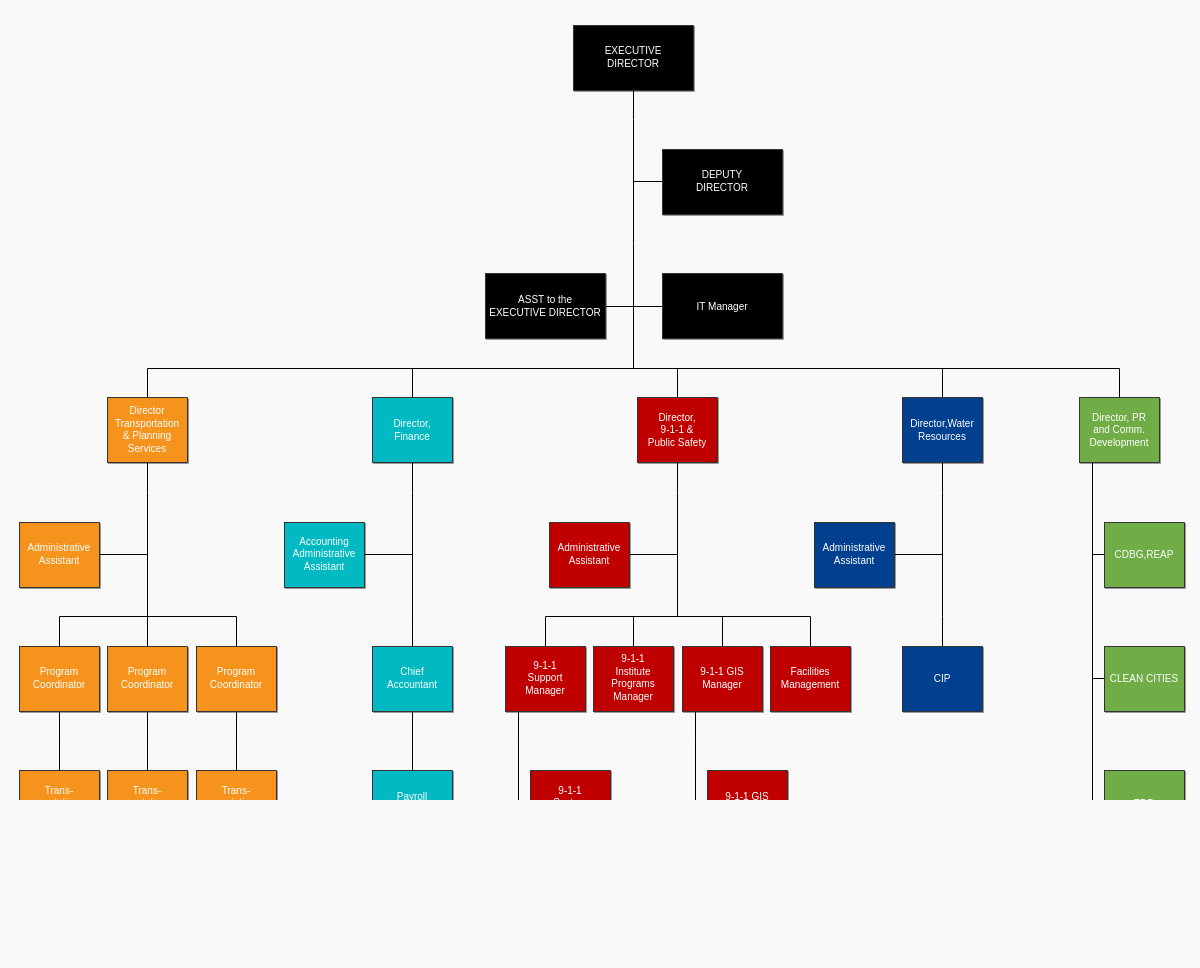
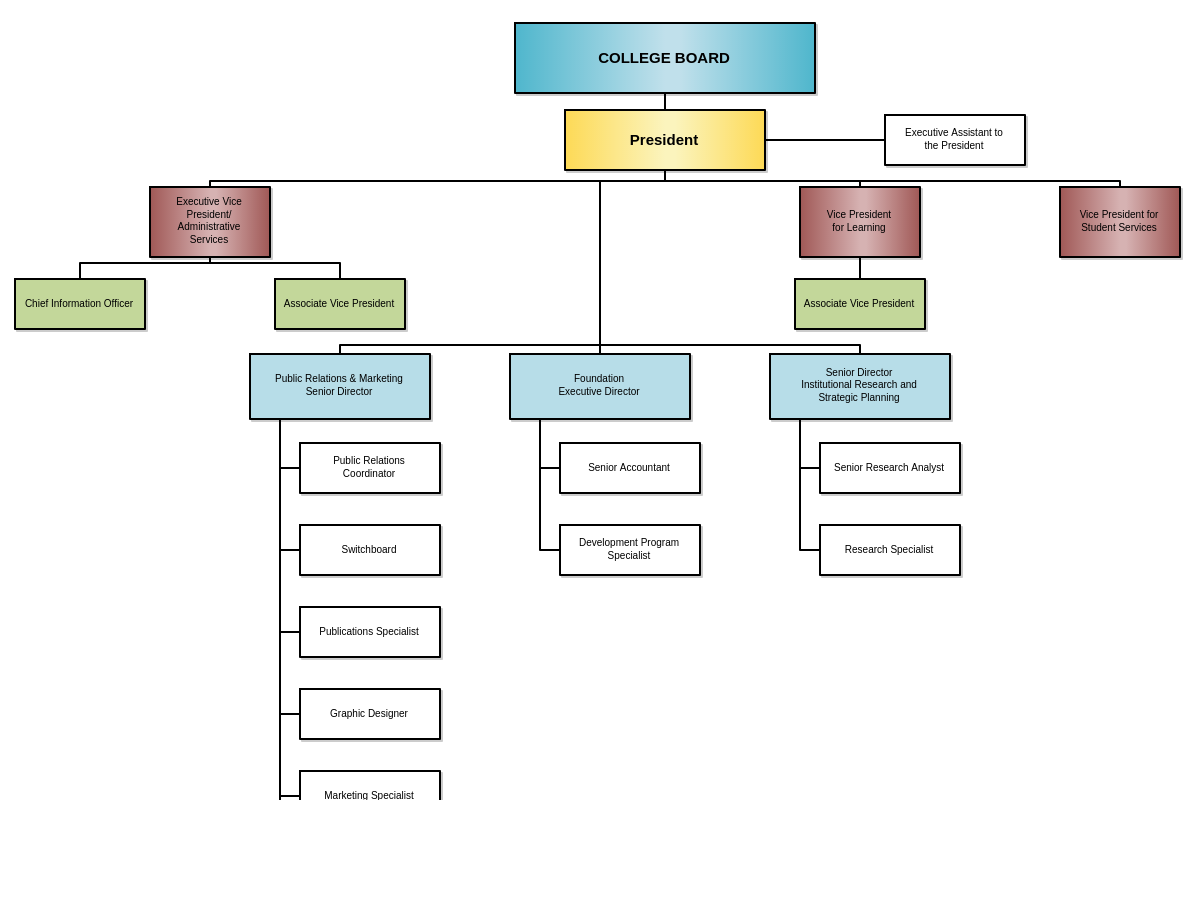
Organizational Tree Diagram
Set to true to enable the organizational tree diagram.
{
  type: 'tree',
  options: {
    orgChart: true,
  },
}
Packing Factor
Sets a factor of the packing algorithm (how close the nodes are forced). Only applies to organizational tree diagrams (options.orgChart = true).
{
  type: 'tree',
  options: {
    orgChart: true
    packingFactor: 10, // default is 1
  },
}
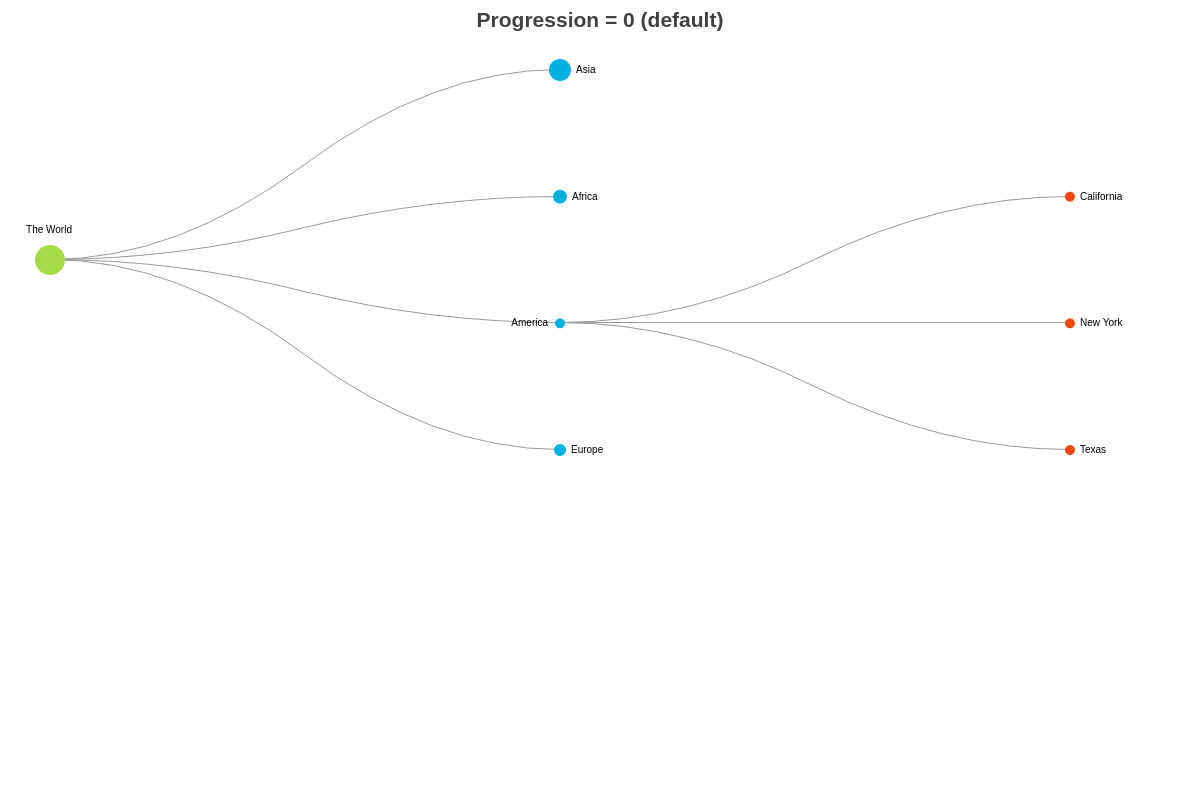
Progression
Sets the progression of the distance between nodes. Accepts values between -1 (decreasing) to 1 (increasing), where 0 sets the nodes to have equal distance.
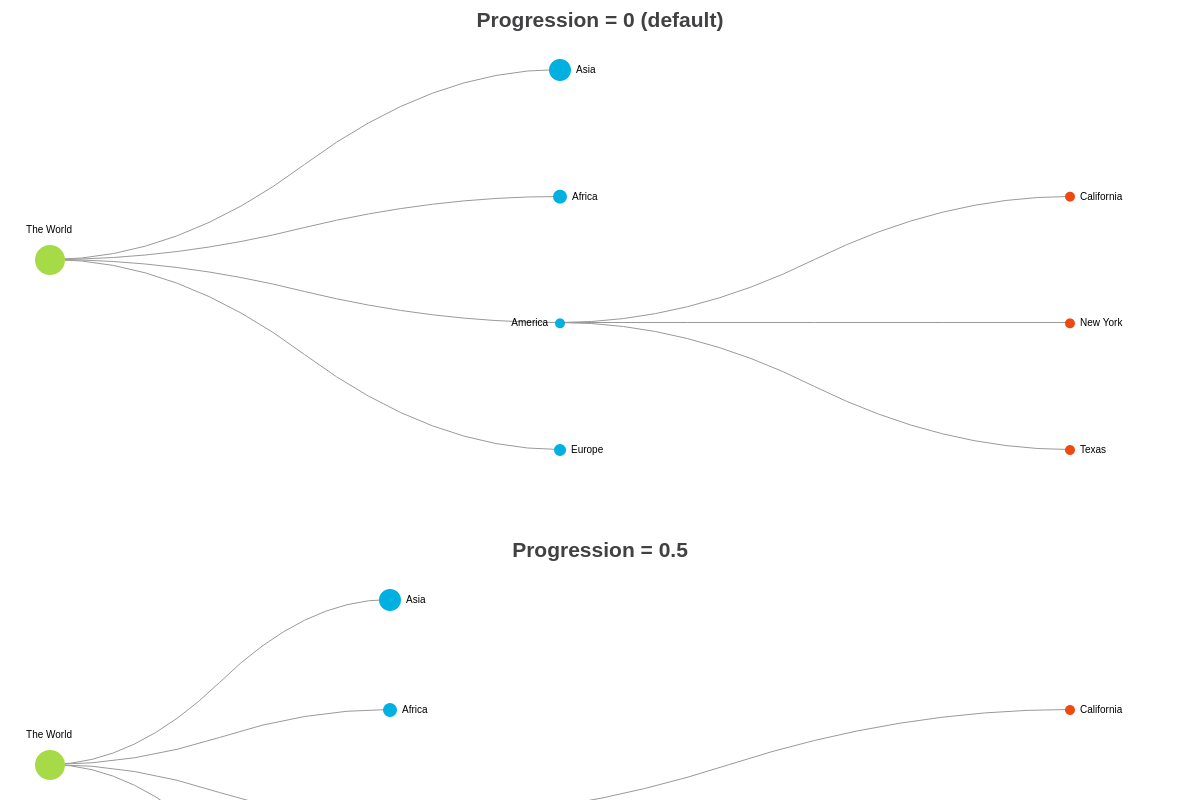
{
  type: 'tree',
  options: {
    progression: 0.5, // default is 1
  },
}
Reference Angle
When aspectType is set to "tree-radial", the refAngle attribute is used to set the reference angle for radial trees.
{
  type: 'tree',
  options: {
    aspectType: 'tree-radial',
    refAngle: 180, // default is 0
  },
}
Weighted Links
When set to true, disables collapsible nodes.
{
  type: 'tree',
  options: {
    weightedLinks: true,
  },
}
Weighted Nodes
Sets whether the size of the nodes will be considered when performing the logic for force directed graphs.

{
  type: 'tree',
  options: {
    weightedNodes: 0.05,
  },
}
Methods
To update the tree, you must use the setdata method.
zingchart.exec('myChart', 'setdata', {
  data: chartConfigObj
});
Further Customization
Once you have your basic grid, you can customize and style it to fit your data visualization needs.
Palette
Use the palette array to specify colors to be used by the nodes. Provide the color values as strings inside the array.
{
  options: {
    palette: ['#2196F3', '#3F51B5', '#42A5F5', '#5C6BC0', '#64B5F6', '#7986CB', '#90CAF9', '#9FA8DA', '#BBDEFB', '#C5CAE9'],
  },
}
Styling Attributes
The following attributes can be used to style tree charts:
| Attribute | Description |
|---|---|
link |
Defines the style for links between nodes |
link[cls-n] |
Defines the style for links with class 'n' |
link[container-n] |
Defines the style for links belonging to container 'n' |
link[group-n] |
Defines the style for links belonging to group 'n' |
link[level-n] |
Defines the style for links in level 'n' |
link[parent-n] |
Defines the style for links with parents 'n' |
link[sibling] |
Defines the style for links between sibling nodes |
link[source-n] |
Defines the style for links coming for source 'n' |
link[target-n] |
Defines the style for links going to target 'n' |
links |
Defines the style for links specified by 'SOURCEID-TARGETID' keys |
node |
Defines the style for nodes |
node[cls-n] |
Defines the style for nodes with class 'n' |
node[collapsed] |
Defines the style for collapsed nodes |
node[container-n] |
Defines the style for nodes belonging to container 'n' |
node[group-n] |
Defines the style for nodes belonging to group 'n' |
node[leaf] |
Defines the style for leaf nodes (nodes without any children) |
node[level-n] |
Defines the style for nodes in level 'n' |
node[parent] |
Defines the style for parent nodes |
node[parent-n] |
Defines the style for nodes that has parent 'n' |
nodes |
Defines individual styles for nodes specified by their id |