Data Basics
[values] Attribute
ZingChart provides the values attribute to store an array of values. There are two main accepted data types in ZingChart: single arrays and multi-dimensional arrays.
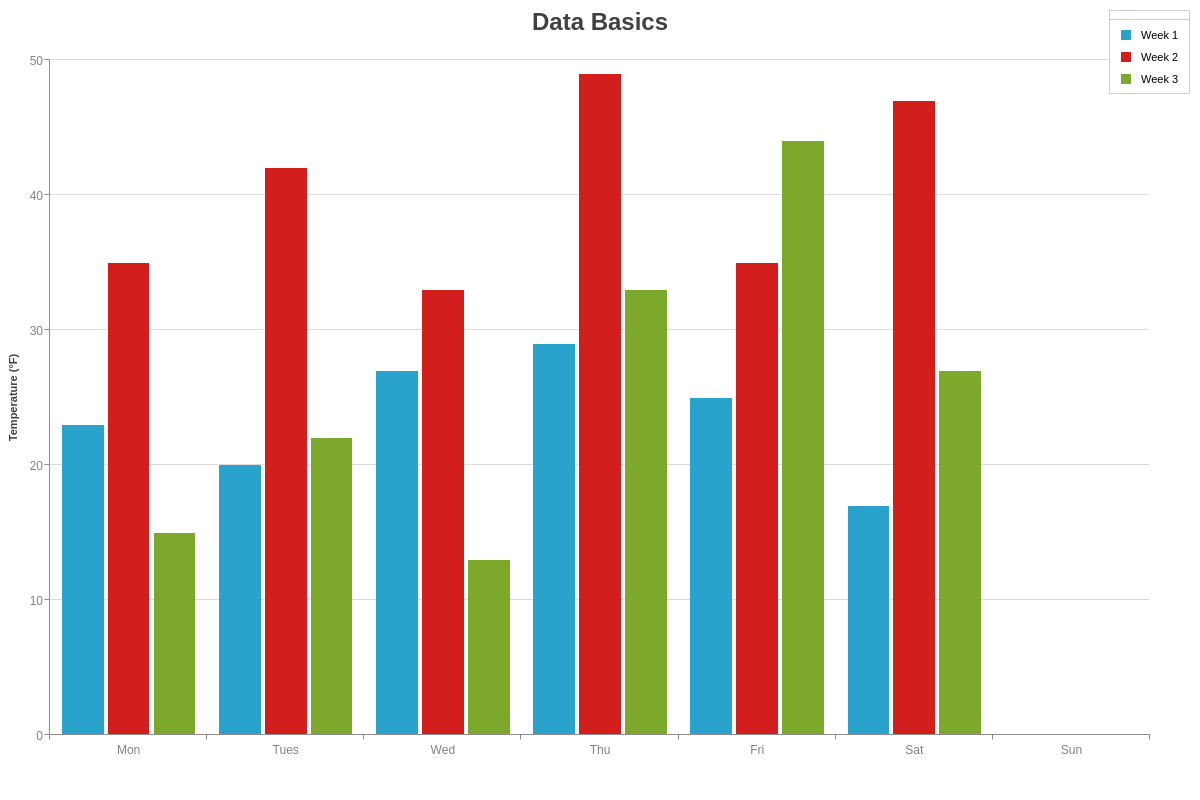
Single Dimensional Array
A standard array is the most common chart type accepted data format in ZingChart. Linear data is the most common form of data as well:
{
    values: [23,20,27,29,25,17,15]
}
Multi Dimensional Array
Non-linear data is represented by multi-dimensional arrays represented by [x,y] for a single node. Typically, the standard use for this is timeseries data [1147651200000, 18921051].You can also use strings instead of numbers to map multi-dimensional arrays ([]).
Using a multi-dimensional array will slow down the chart because of the 2D array. You will see a speed decrease around 20k nodes.
String values
The main use case for using strings to map multi-dimensional arrays is to set the x-axis labels easily.
values: [
  [ 'Mon', 23 ],
  [ 'Tue', 20 ],
  [ 'Wed', 27 ],
  [ 'Thu', 29 ],
  [ 'Fri', 25 ],
  [ 'Sat', 17 ],
  [ 'Sun', 15 ]
]
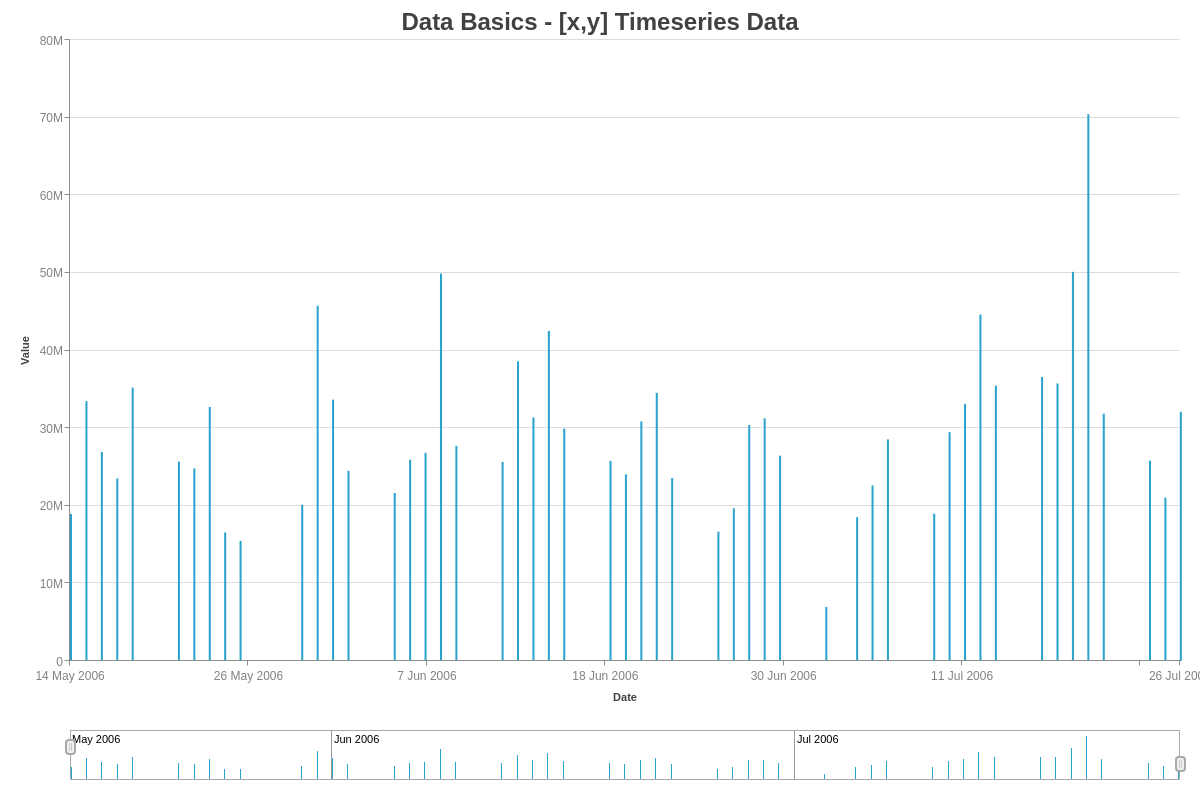
Timeseries data
Non-linear data means that your timestamps won't have an equal step. If you are plotting a chart that has a consistent time interval, you do not need to use this data format. Timeseries data also allows certain features in a chart like displaying scale dates and adding default zoom buttons.
Timeseries values use 'millisecond' values in ZingChart. If you have second values, just multiply by 1000.
values: [
  [1147651200000, 18921051],
  [1147737600000, 33470860],
  [1147824000000, 26941146],
  [1147910400000, 23524811],
  [1147996800000, 35221586],
  [1148256000000, 25680800],
  [1148342400000, 24814061]
]
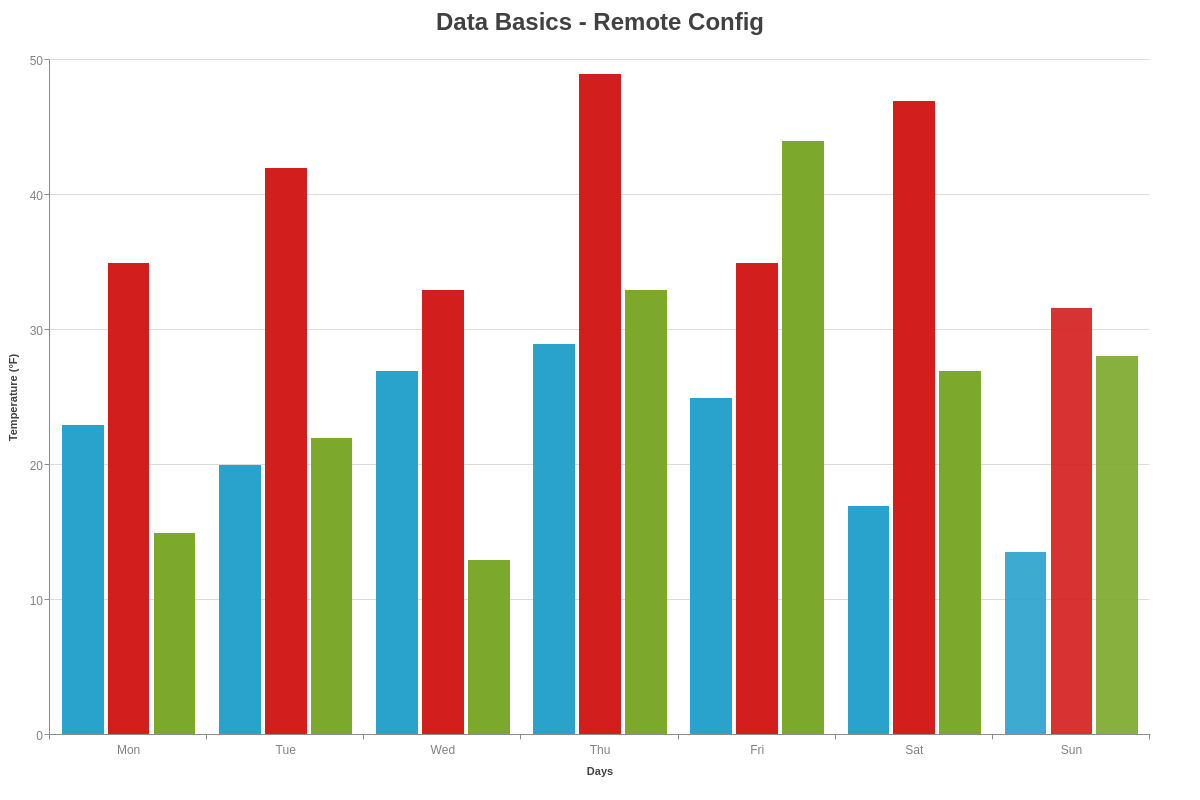
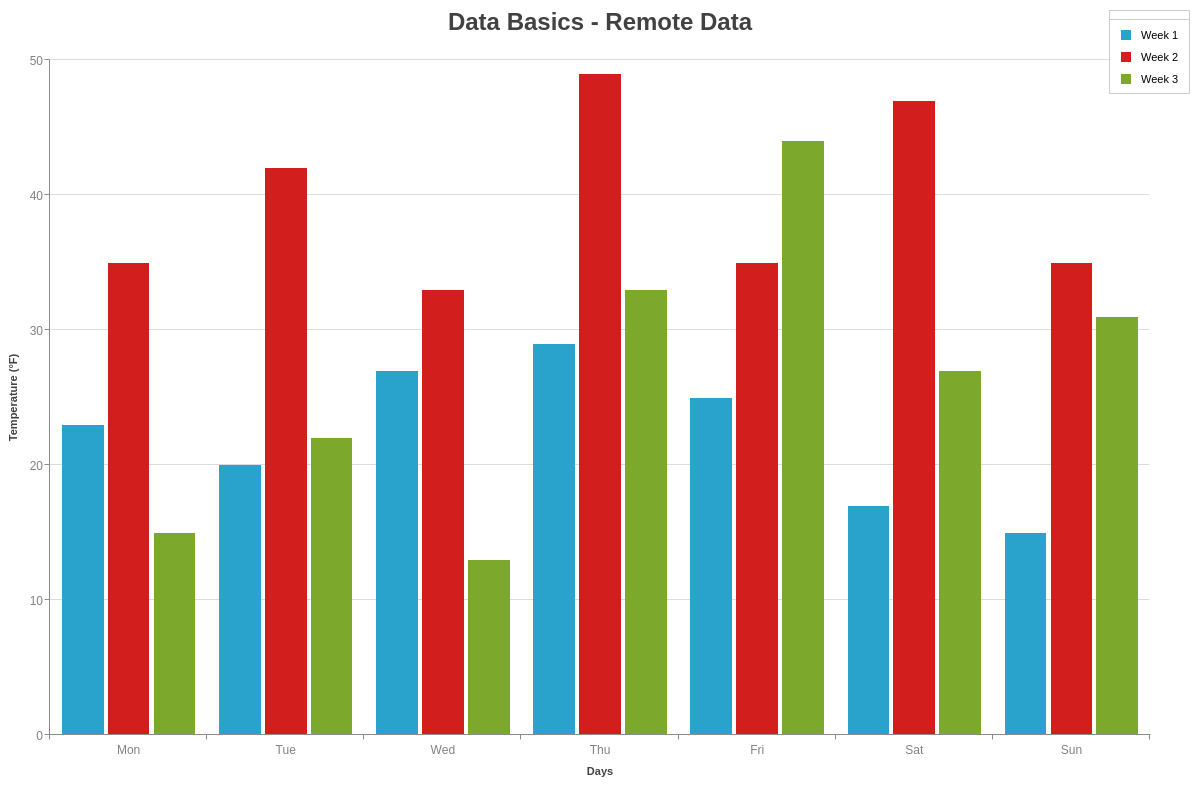
Remote JSON Config
You can target a remote or local .json file to populate the chart configuration. This is enabled through the dataurl property.
JSON performance is much quicker than JavaScript object performance. Shipping JSON configurations is the fastest way for the browser and ZingChart to render charts.
zingchart.render({
  id: 'myChart',
  dataurl: 'https://app.zingsoft.com/api/file/DSVE88FZ/remote-config.json',
  height: '100%',
  width: '100%'
});

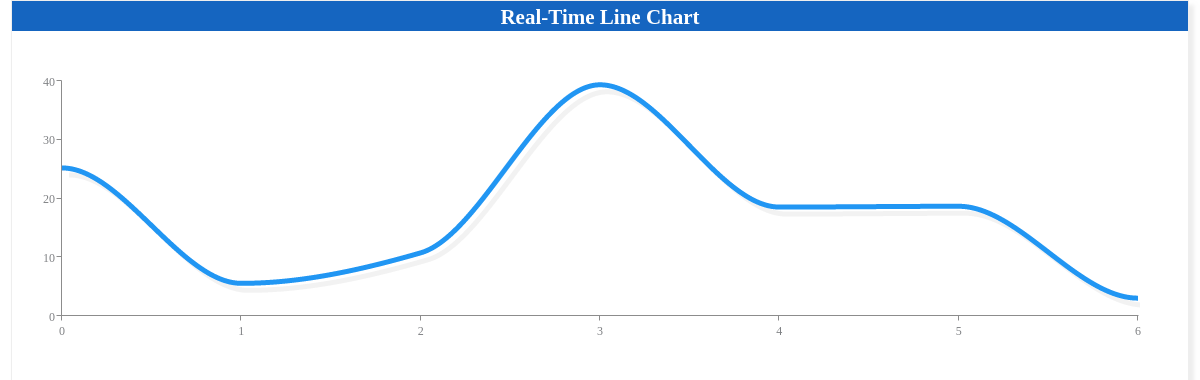
Feed Data
It is a common to have a dynamic endpoint or file with a set of values that is changing. You can easily hook up that endpoint/feed with the refresh object. ZingChart has native implementation for polling and displaying data. You can read more about this in our feed docs.
// Real-time feed
refresh: {
  type: 'feed',
  transport: 'http',
  // 'url' is a endpoint that will return a single new value
  // every 200ms (as defined by 'interval' property)
  url: 'https://us-central1-zingchart-com.cloudfunctions.net/public_http_feed?min=0&max=40&plots=1',
  interval:200,
  maxTicks:10,
  adjustScale: true,
  resetTimeout: 10,
},
AJAX
It's common to request remote data from an endpoint. If you don't want to use the built-in ZingChart methods, you can use our API setdata or setseriesvalues methods.
setdata
You can fetch the whole chart configuration and use setdata to instantiate the chart or override the current chart.
fetch('https://cdn.zingchart.com/datasets/remote-config.json')
  .then(res => res.json())
  .then(results => {
  	// Use setdata to instantiate the chart
  	zingchart.exec('myChart', 'setdata', {
      data: results
    });
  })
setseriesdata/setseriesvalues
You can fetch the data for the chart and use setseriesvalues or setseriesdata to hydrate the chart later. Which method you choose depends on how much information is in the series object you need/want to update.
setseriesdata
You can find more information about setseriesdata in our api docs.
fetch('https://cdn.zingchart.com/datasets/remote-data.json')
  .then(res => res.json())
  .then(results => {
  	// Use setseriesdata to instantiate the chart data
  	zingchart.exec('myChart', 'setseriesdata', {
      data: results
    });
  })

setseriesvalues
You can find more information about setseriesvalues in our api docs.
fetch('https://cdn.zingchart.com/datasets/remote-seriesvalues.json')
  .then(res => res.json())
  .then(results => {
  	// Use setseriesdata to instantiate the chart data
  	zingchart.exec('myChart', 'setseriesvalues', {
      values: results
    });
  })
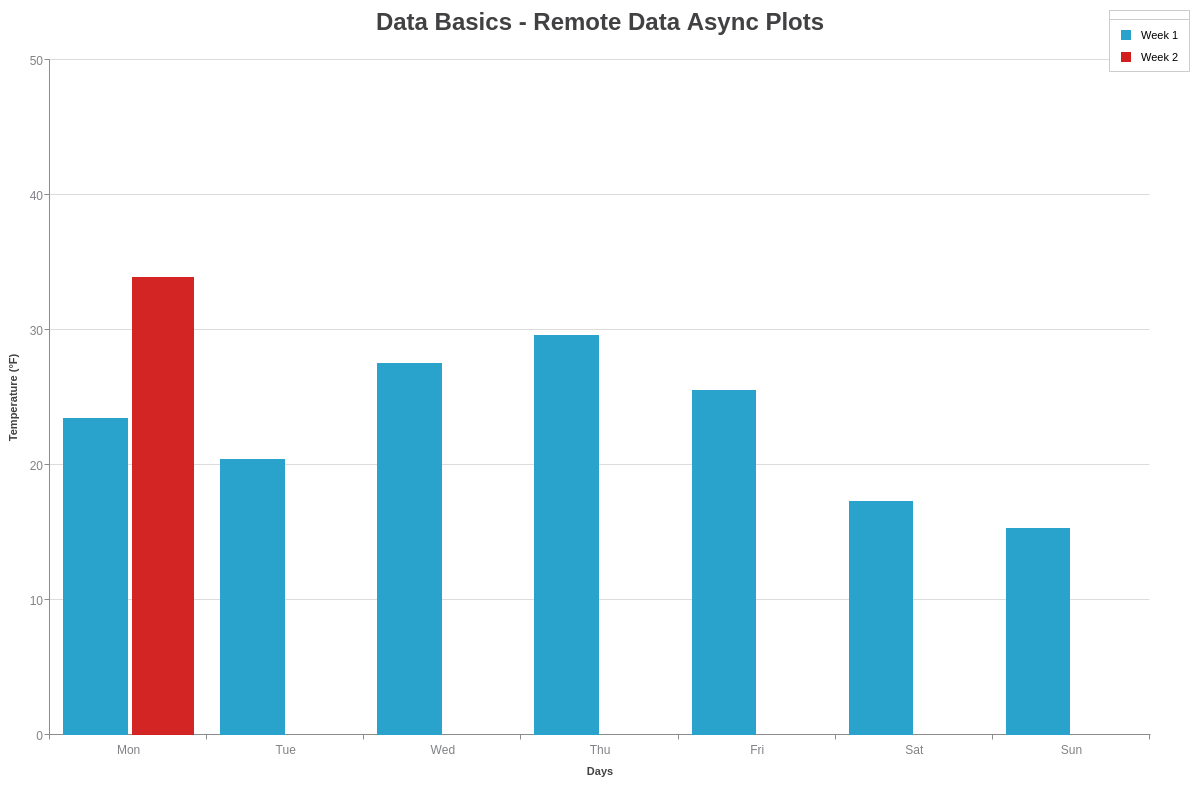
Async (addplot)
Rendering plots asynchronously is easy; just use the addplot method to append plots to the current chart. You can find more information about addplot in our api docs.
fetch(`https://cdn.zingchart.com/datasets/remote-data-plot1.json`)
  .then(res => res.json())
  .then(results => {
  	// Use addplot to instantiate the chart data
  	zingchart.exec('myChart', 'addplot', {
      plotindex: 1,
      data: results
    });
  })
Loading Screen
You can display a loading screen on the chart by adding the noData object.
noData: {
  text: 'Fetching remote data...',
  backgroundColor: '#eeeeee',
  fontSize: 18
}
Moving Forward
Some chart types use different data objects. Check out the values doc for accepted chart types data structures. You now understand basic local and remote data assignment. If you want to learn more about features in ZingChart, read our where to go next.