Using the ZingSoft Studio
Overview
The ZingSoft Studio is akin to any other sandboxing tools you may have seen, such as CodePen or CodeSandbox. You are able to create an account, make a chart (using one of our prefilled templates!), and edit, save, and share your chart as you wish! It's a great way to try out ZingChart without having to get a full local environment set up - by the end of this tutorial, you'll have created and saved your first chart in the Studio. Let's get started!
Creating an Account

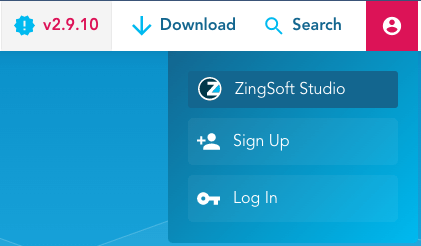
If you haven't already, you will need to create an account with us in order to access the Studio. In the upper right hand corner of this page, select the user icon to toggle the user menu. Then, select the "Sign Up" link to sign up for the Studio.
Navigating to the Studio

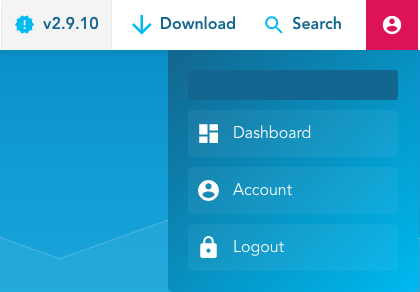
You can always navigate directly to the Studio by visiting app.zingsoft.com or by navigating back to the user menu mentioned in the last step and selecting the "ZingSoft Studio" or "Dashboard" link - the view will change depending on whether you are logged into our site!
Creating Your First Chart

On the left hand side of the Studio, you will see a file folder icon and a plus icon. Similar to your computer, the file folder will direct you to your dashboard, where all of your charts will be saved for you to reference later. Clicking on the plus will allow you to create a new chart by forking one of our prebuilt templates. We have a template for every chart type to get you started!
Editing, Saving, and Sharing Your Chart

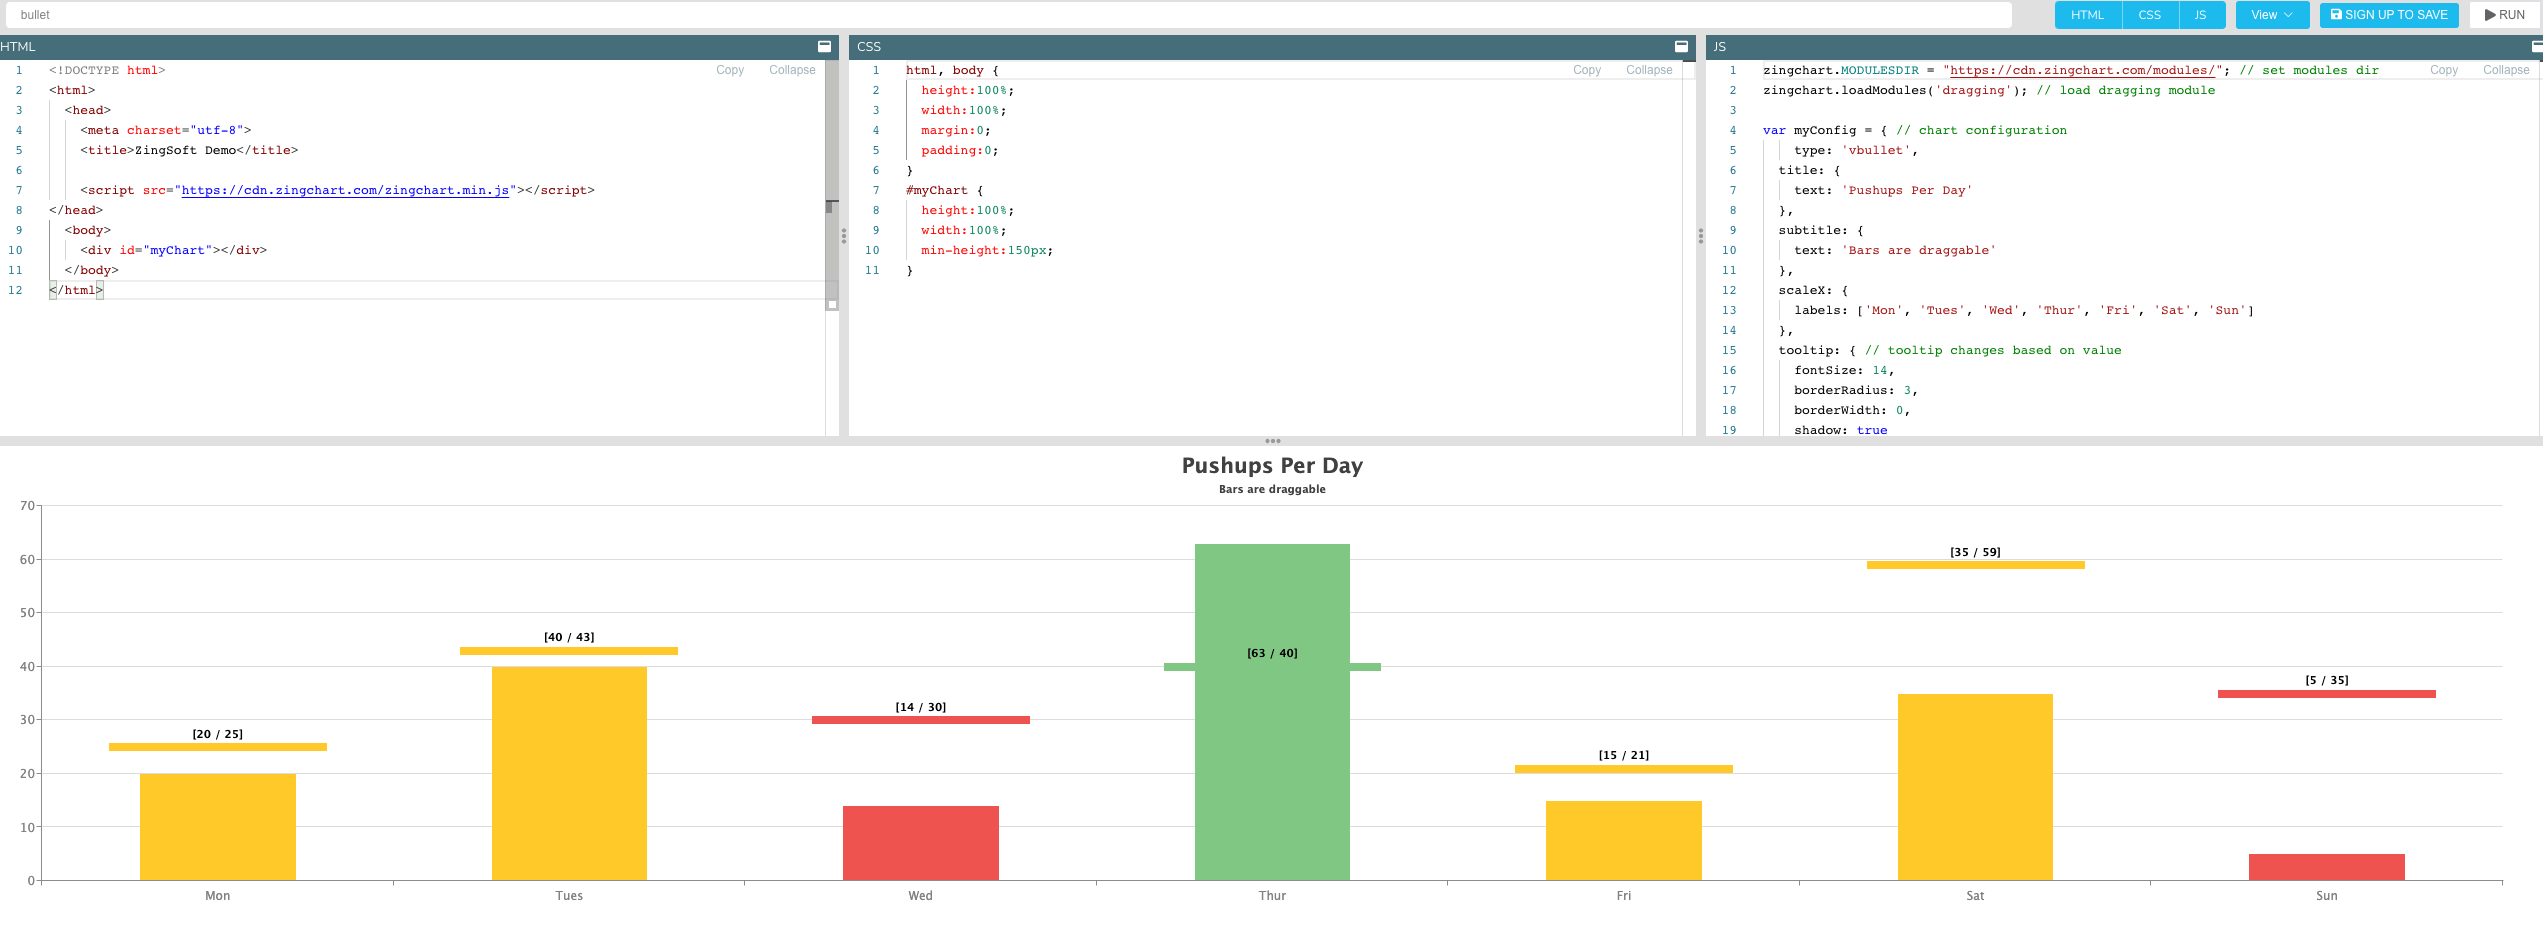
Once you create a chart by selecting a template to fork, you can edit any of the HTML, CSS, or JS. Change the view by toggling the buttons for each language. You can view different versions of your chart and get the direct iframe embed code under the view button menu. Save allows you to save your chart to your dashboard. To test the code you write, use the run button.