Heatmap Plugin
Heatmap Plugin Object
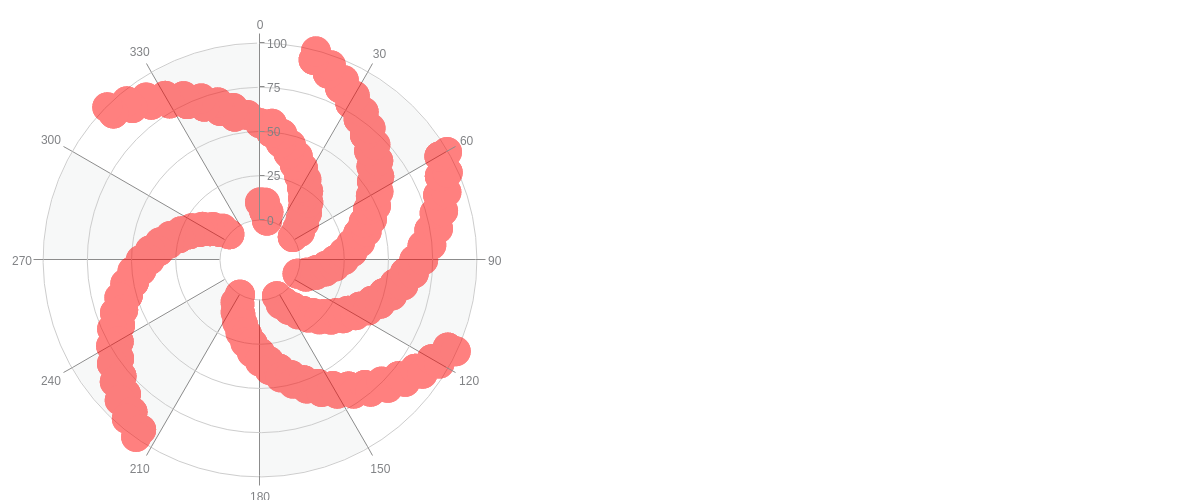
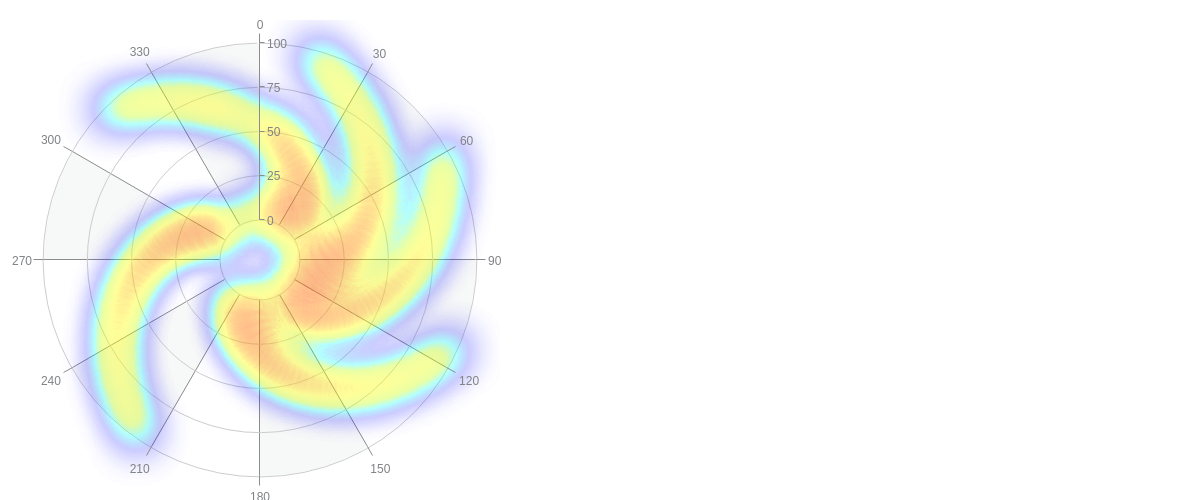
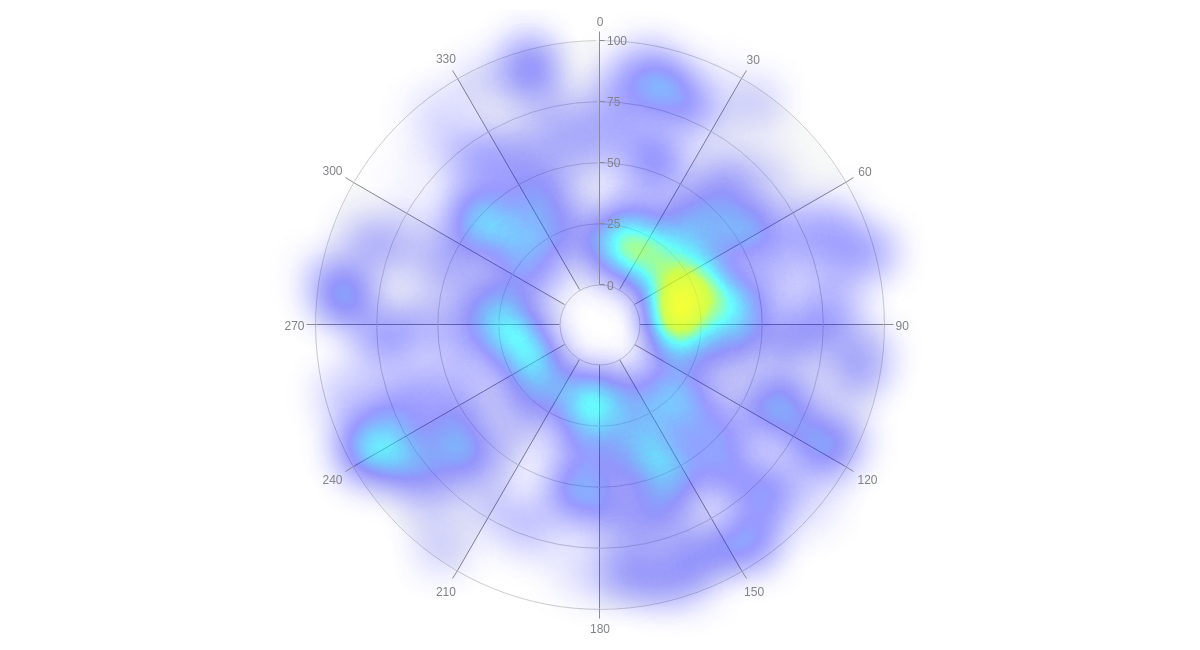
In your chart object, add another object called heatmap. In the following example, a radar chart will be used as an underlay. Use heatmap.setdata to give the plugin some data to display. Without further modification, a basic density map with a simple simple math function looks like this:
{
  type: 'radar',
  heatmap: {},
}
...,
var MAX = 100;
var aData = [];
zingchart.bind('zc', 'load', function() {
  var l, k, v;
  var iMaxPoints = 512;
  for (l=0;l<iMaxPoints;l++) {
    k = 5 * Math.round(((iMaxPoints-l)%355) / 5);
    v = 5 * Math.round((l%100) / 5);
    aData.push([k, v, MAX]);
  }
  zingchart.exec('zc', 'heatmap.setdata', {
    data : aData
  });
});
Data
To enter data into the heatmap, use heatmap.setdata to set the data attribute. The data attribute accepts a dataset in the form of a series of arrays. Each array contains a key, value, and maximum integer provided in the following format:
data: [[key1, val1, max1], [key2, val2, max2], ..., [keyN, valN, maxN]]
The heatmap plugin supports multiple ways to arrange its data. Use the graph object and set keyScale and valScale to the scale of the underlay chart.
For the radar chart example above, the data keys lie on the k- scale, and the key values lie on the v-scale. To use the heatmap plugin with this chart, assign keyScale to scale-k and valScale to scale-v.
{
  type : 'radar',
  heatmap : {
    graph : {
      keyScale : 'scale-k',
      valScale : 'scale-v'
    }
  },
}
Heatmap Plugin- specific Properties
You can modify how your heatmap displays your data. Using different attributes, such as brushType, size, composite, and others, the data can be made to fit any style.
Async
Use the async to set the heatmap to be painted in async mode (in batches) to avoid blocking the browser.
{
  heatmap : {
    async: true
  },
}
Blur
Use the blur attribute to increase or decrease the amount of blur that appears around each shape. Increasing this will increase the amount of surface area each shape takes up. Enter a number, pixel, or percentage value.
{
  heatmap : {
    blur: '70px'
  }
}
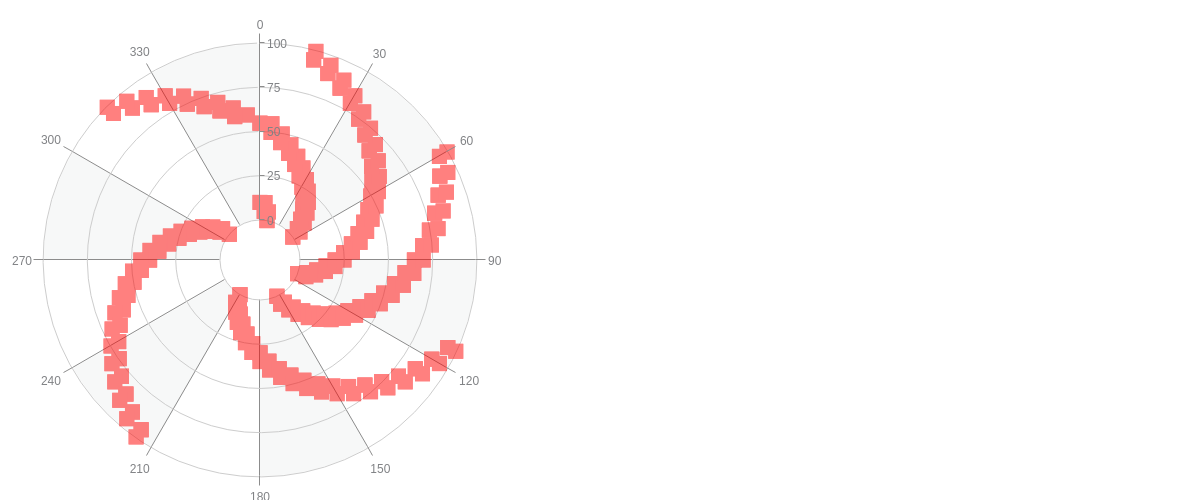
Brush Type
Use the brushType attribute to modify what shape the heatmap is painted with. The brushType value options include: circle and square.
{
  type : 'radar',
  heatmap : {
    brushType: 'square' //'circle'
  },
}
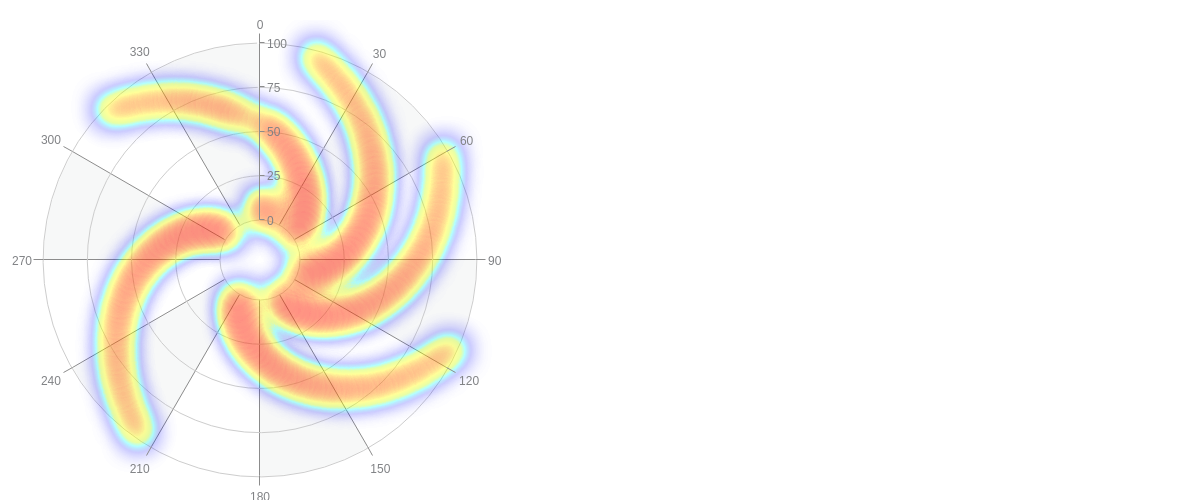
Composite
Use the composite attribute to blend shapes together for the classic heatmap look (the color shifts more towards red where a greater number of stacked shapes are present). The composite value options include: true and false.
{
  heatmap : {
    brushType: 'circle',
    size: '10px',
    composite: true
  },
}
Discrete
Use the discrete attribute to plot data by distinct colors instead of
continuous gradient.
This plotting method makes it easier to identify patterns in clustered data.
{
  heatmap : {
    discrete: true
  },
}
Graph
The graph attribute accepts a boolean value or object.
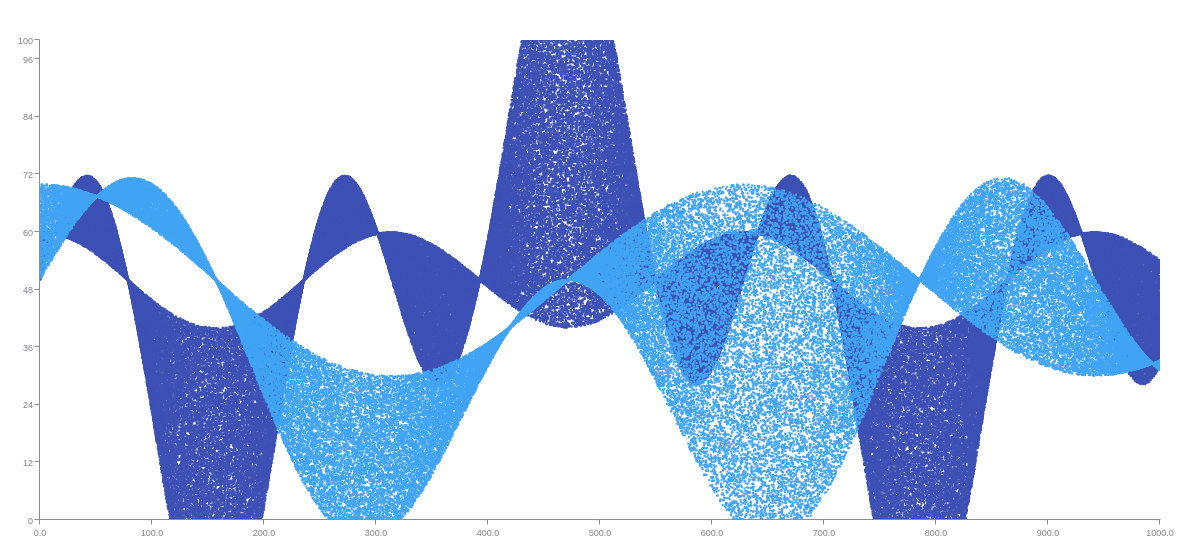
To create a scatter-heatmap chart, graph is set to true.
Then use with brushType, gradientColors and gradientStops to add heatmap features to the scatter chart.
{
  heatmap: {
    graph: true
  },
}
By default, the key and value scales are set to x- and y-scale, respectively.
For other heatmap chart that does not use the x- and y-scale, use graph to configure the scales.
For example in radar-heatmap charts, use the graph attribute to specify the keyScale and valScale to 'scale-k' and 'scale-v', respectively.
{
  heatmap: {
    graph: {
      keyScale: 'scale-k',
      valScale: 'scale-v'
    }
  },
}
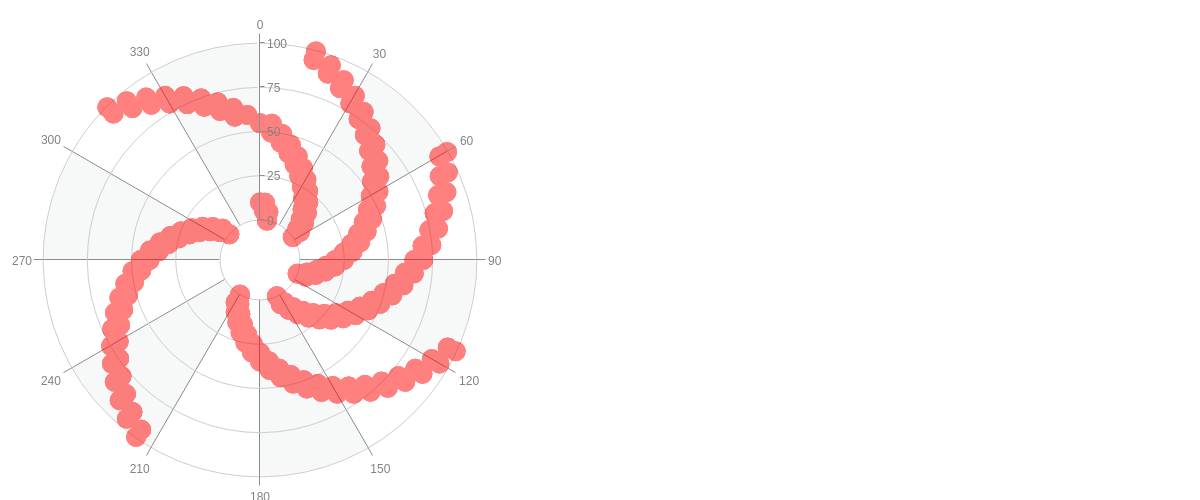
Size
Use the size attribute to modify how large each painted shape is. Enter a number, pixel, or percentage value.
{
  heatmap : {
    brushType: 'circle',
    size: '10px'
  },
}
Further Customization
Further customize your heatmap plugin by configuring a few important features to highlight exactly what you want to display.
Alpha
With heatmap plugin charts, you'll most likely want to find a balance between the underlay and the heatmap itself. The alpha attribute causes the heatmap to become semi-transparent. Include any value between 0.0 (transparent) to 1.0 (completely solid) and make sure to place a zero before your decimal point. By default, the alpha attribute is set to 0.5.
{
  heatmap : {
    alpha: 1
  }
}

Gradient
Use the gradientColors and gradientStops attributes to specify color gradient to apply to the heatmap.
{
  heatmap : {
    async: true
  },
}
Tooltip
By default, the tooltip object displays the numerical value of each point on the heatmap.
Note: Learn more about tooltips with our Tooltips Tutorial. See more styling options on our tooltip JSON Configuration page.
{
  heatmap : {
    tooltip: {
    	decimals: 1
    }
  }
}
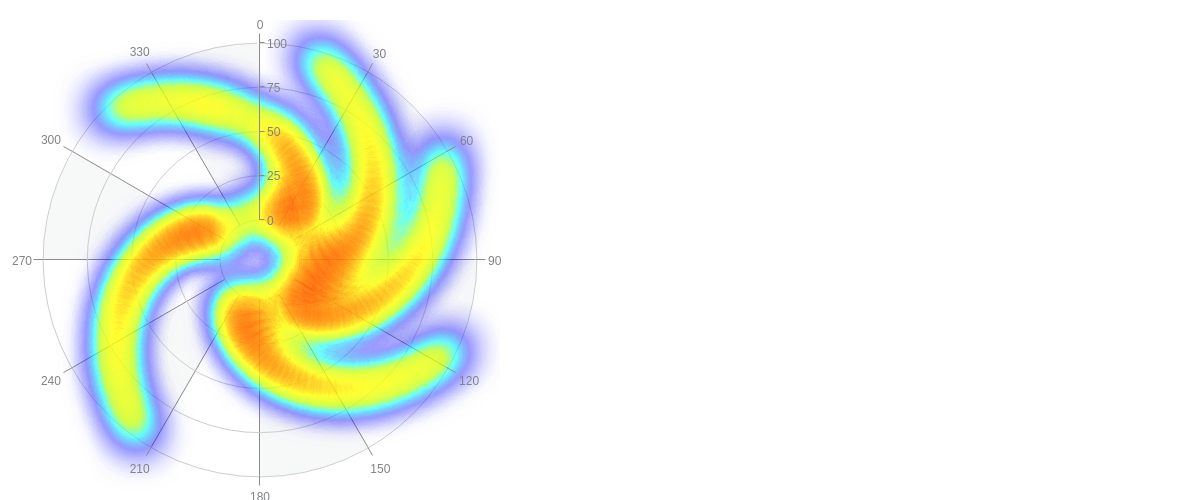
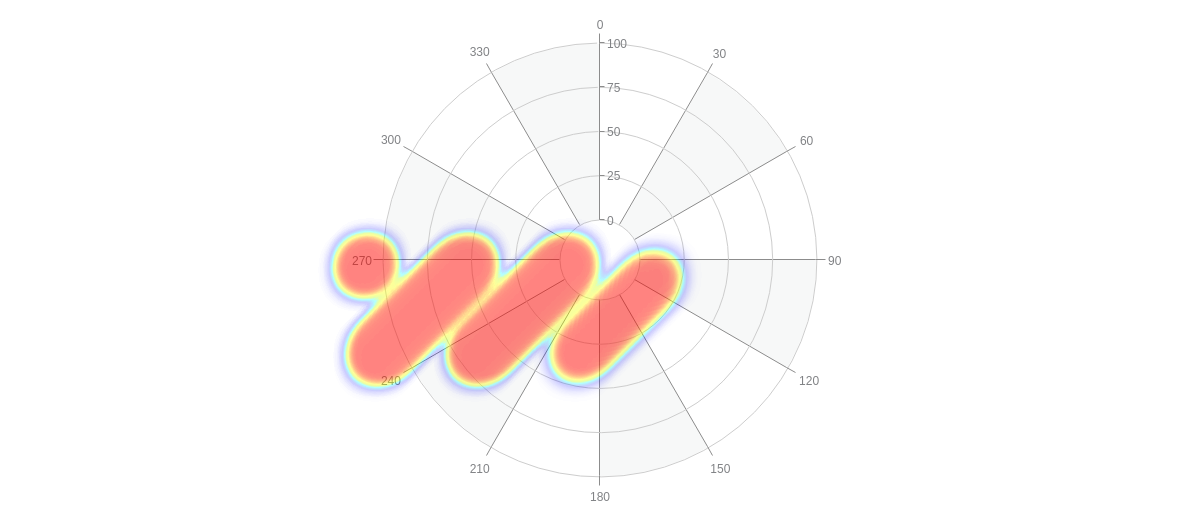
Live Updating
Heatmap plugins can be brought to life using window.setInterval. With a more involved math function that updates the heatmap every 15 milliseconds, you can achieve a visual look like the following:
type : 'radar',
  heatmap : {
    graph : {
      keyScale : 'scale-k',
      valScale : 'scale-v'
    },
    brushType: 'circle',
    size: '10px',
    composite: true,
    blur: '70px',
    alpha: 1
  }
}
...,
var MAX = 100;
var aData = [];
zingchart.bind('zc', 'load', function() {
  window.setInterval(function() {
      var l, k, v;
      var iMaxPoints = 512;
      if (aData.length === 0) {
          for (l=0;l<iMaxPoints;l++) {
            k = 5 * Math.round(ZC._r_(0, 355) / 5);
            v = 5 * Math.round(ZC._r_(10, 100) / 5);
            aData.push([k, v, MAX*Math.random()]);
          }
      } else {
          for (l=aData.length-1;l>=0;l--) {
            aData[l][2] = Math.min(MAX, aData[l][2] - (MAX/19) + (MAX/20)*Math.random());
            if (aData[l][2] <= 0) {
              aData.splice(l, 1);
            }
          }
          for (l=0;l<iMaxPoints-aData.length;l++) {
            k = 5 * Math.round(ZC._r_(0, 355) / 5);
            v = 5 * Math.round(ZC._r_(10, 100) / 5);
            aData.push([k, v, MAX*Math.random()]);
          }
      }
      zingchart.exec('zc', 'heatmap.setdata', {
        data : aData
      });
  }, 15);
});
Other Chart Underlays
Most chart types can be used as underlays. The following types are compatible with the heatmap plugin: null, area, bar, boxplot, bubble-pie, bubble, bullet, calendar, funnel, gauge, piano, heatmap, line, nestedpie, pareto, radar, range, scatter, stock, venn, and waterfall.
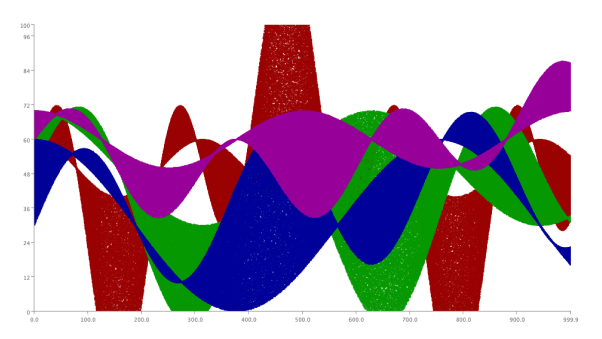
Mixed Charts Using Null
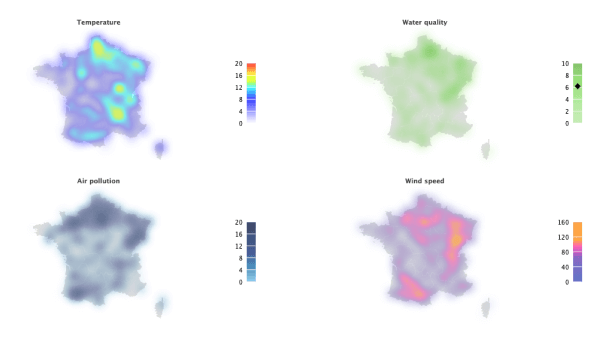
Map Using Null
Mixed Maps Using Null