Violin Chart
Note: See our Violin Chart Gallery for inspiration on all the different violin chart possibilities.
Violin Chart Type
ZingChart violin charts (aka jitter charts) use the type="scatter" attribute. In your chart object, add an options: { violin: {} } object to enable the violin plugin.
{
	type: 'scatter',
	options: {
		violin: {} // will initiate the plugin
	}
};
Data
Violin charts use the same data format as a scatter chart. To enter data into the chart, use the series array. Each object in the series array requires a values array to function properly. This is where you'll specify your data as x- and y-axis values.
Note: Learn more about the series array with our series JSON Configuration page.
{
	series: [
		{
			values: [
				[1,9], //[x-value, y-value]
				[2,15],
				[3,21],
			]
		}
	]
}
Chart-Specific Properties
Enhance and modify how the violin chart looks with a violin object inside an options object.
The following demo illustrates the different options available for the violin chart modifications discussed below:
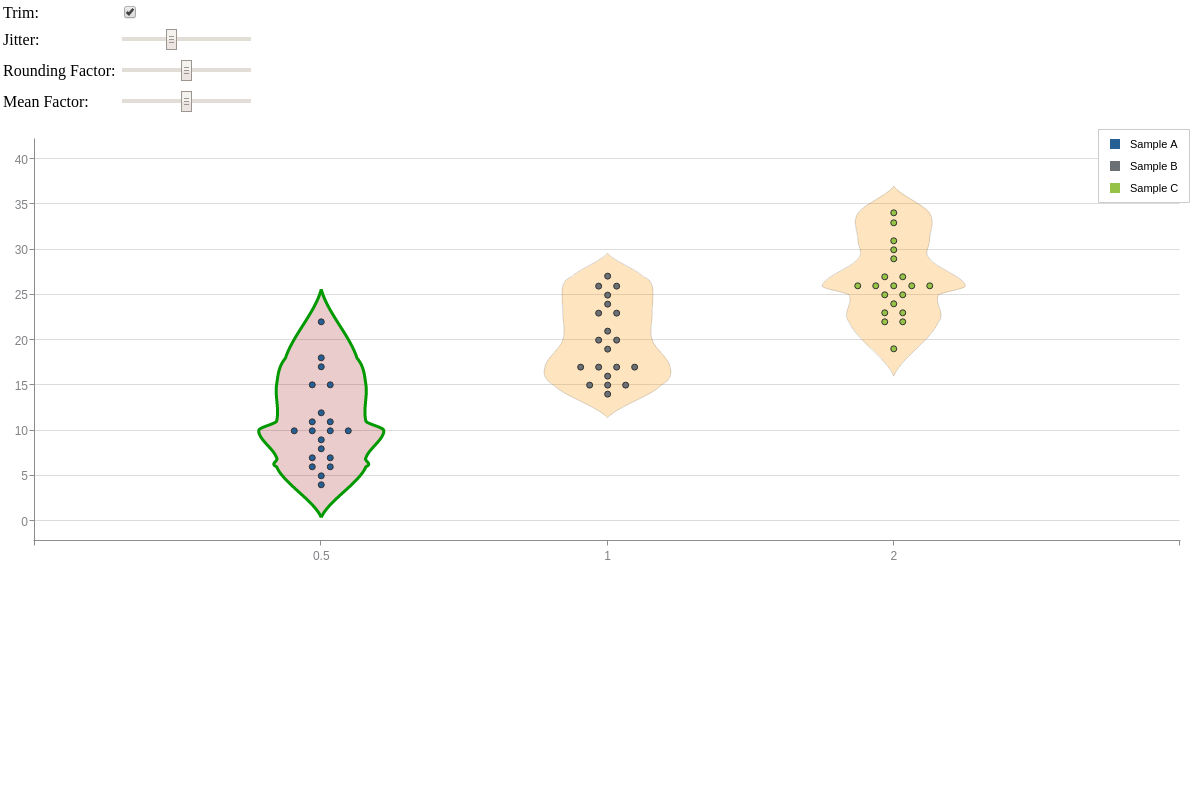
Trim
Adjust the trim on the violin chart with the trim attribute. This will change whether the tip and base of the chart appears pointed or flat. Provide a value of 0 for true (default) or 1 for false.
options: {
	violin: {
		trim: 0, // true | false
	}
},
Jitter
Adjust the jitter on the violin chart with the jitter attribute. This will affect the width and spacing of the shaded region. Enter a numeric value.
options: {
	violin: {
		jitter: 1.25,
	}
},
Rounding Factor
Adjust the rounding factor on the violin chart edges with the roundingFactor attribute. Enter a numeric value.
options: {
	violin: {
		roundingFactor: 1,
	}
},
Mean Factor
Adjust the mean factor on the violin chart with the meanFactor attribute. This affects the overall shape of the chart. Enter a numeric value.
options: {
	violin: {
		meanFactor: 2,
	}
},
Styling
Use the style object inside the violin object to style the shaded region of the violin charts.
options: {
	violin: {
		// general styling
		style: {
			backgroundColor: '#ff9900',
			alpha  : 1,
			lineWidth  : 1
		}
	}
},
Styling can also be applied locally to individual series objects.
series: [
	{
		text: 'Sample A',
		// specific styling
		violin: {
			backgroundColor: '#900',
			alpha: 1,
			alphaArea: 0.2,
			lineWidth: 3,
			lineColor: '#090'
		},
		values: [...]
	}
]