CSV Data Sources
Overview
ZingChart offers a variety of ways to display different forms of data on a single chart. Data sources can be used to allow for updating of individual charts easily.
Usage
During the charting process, you may want to offer different ways to view data on a single chart, and have it update as data changes. For example, you may have a dozen or more charts employed that need regular updating. Using data sources, you can use external files to store the chart data and update those files quickly without having to always update the chart source data. ZingChart will pull in the updated data and display it dynamically.
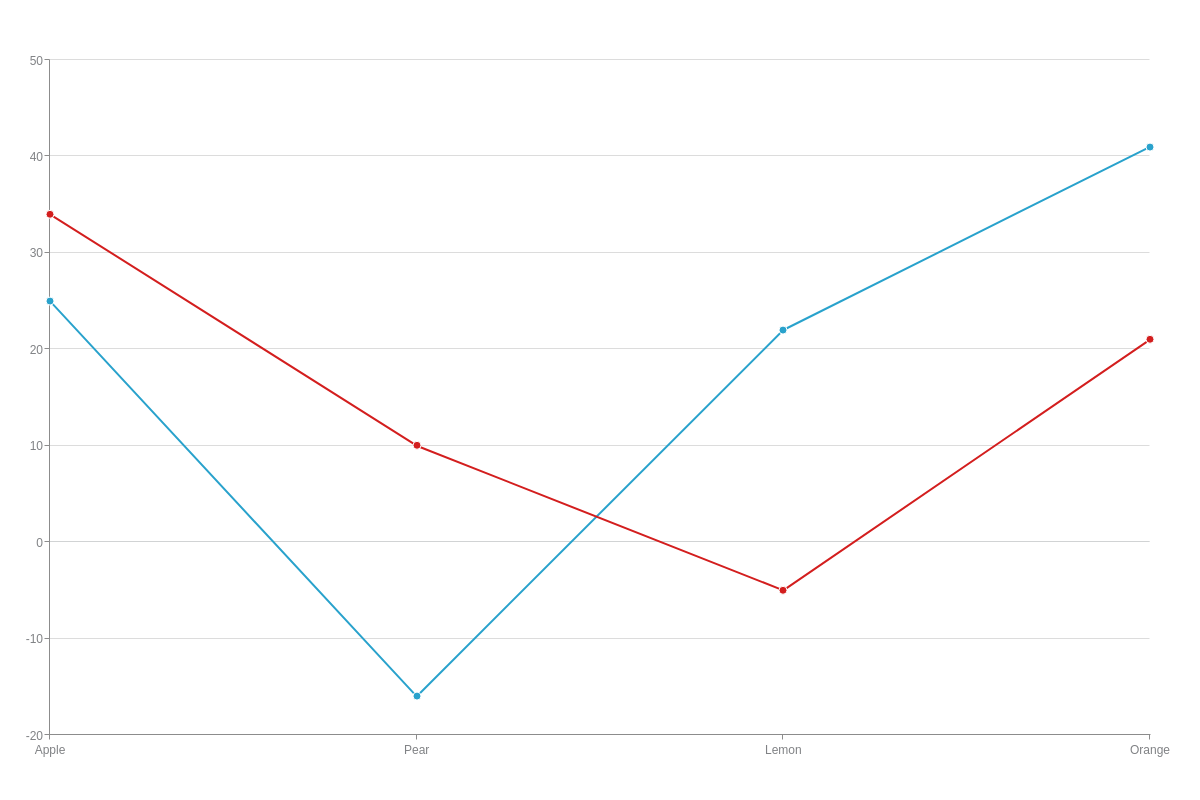
CSV Files
Importing graph data from an external CSV is simple. Just specify the location of the external file (.csv, .txt, .php) by setting the path with the "url" attribute.
csv: {
    url: "./resources/fruit.csv"
}
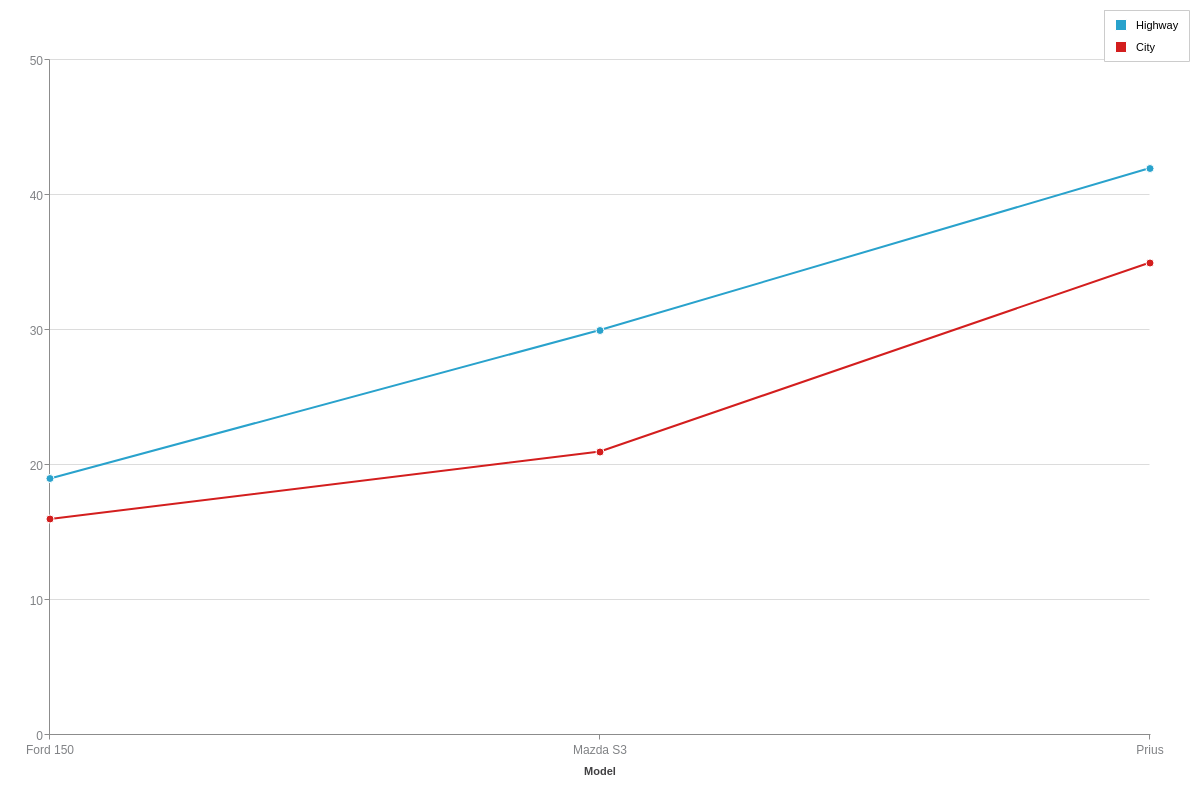
Data Strings
The "data-string" attribute allows you to input the CSV data directly as a string. The row separator character will likely need to be set with the "row-separator" attribute when using the "data-string" attribute.
Furthermore, if your file contains a value separator other than ", " you can specify it using the "separator" attribute. By default, the value separator is ", " but any single character can be used as a separator.
csv: {
    'data-string': "Model|Highway|City_Ford 150|19|16_Mazda S3|30|21_Prius|42|35",
    'row-separator': "_",
    separator: "|"
}
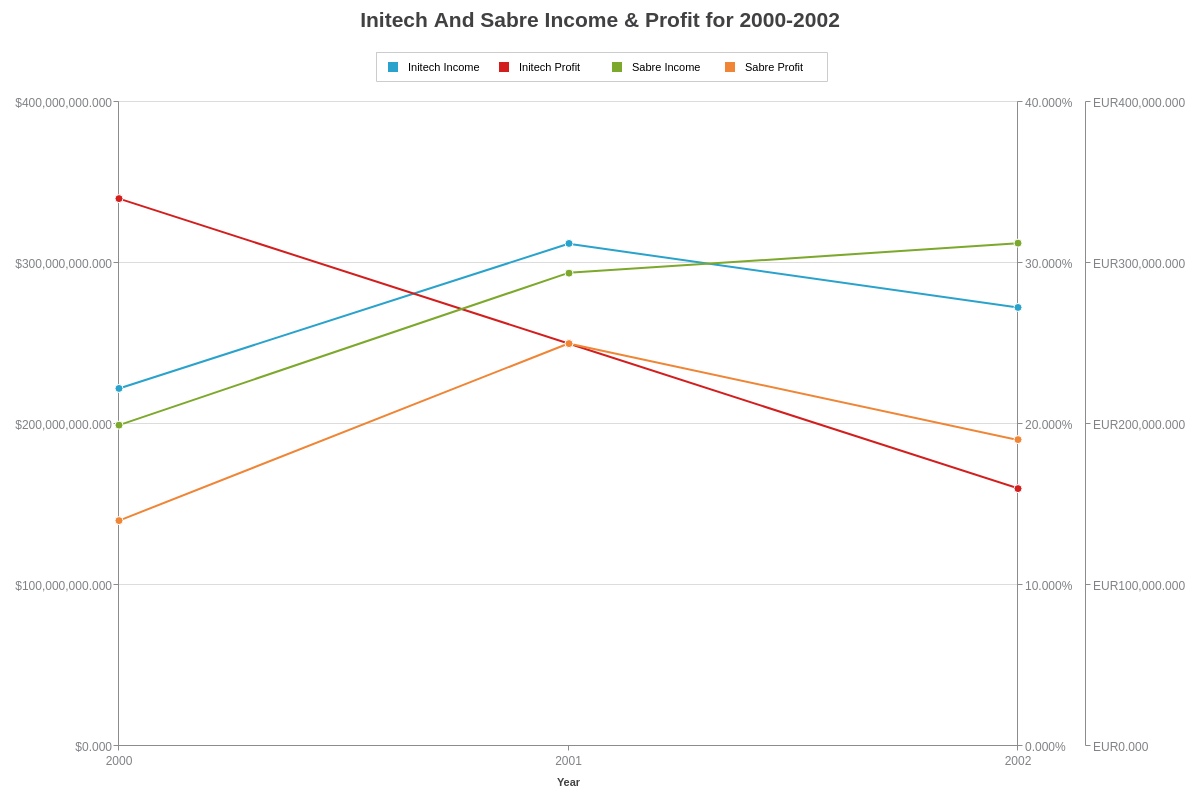
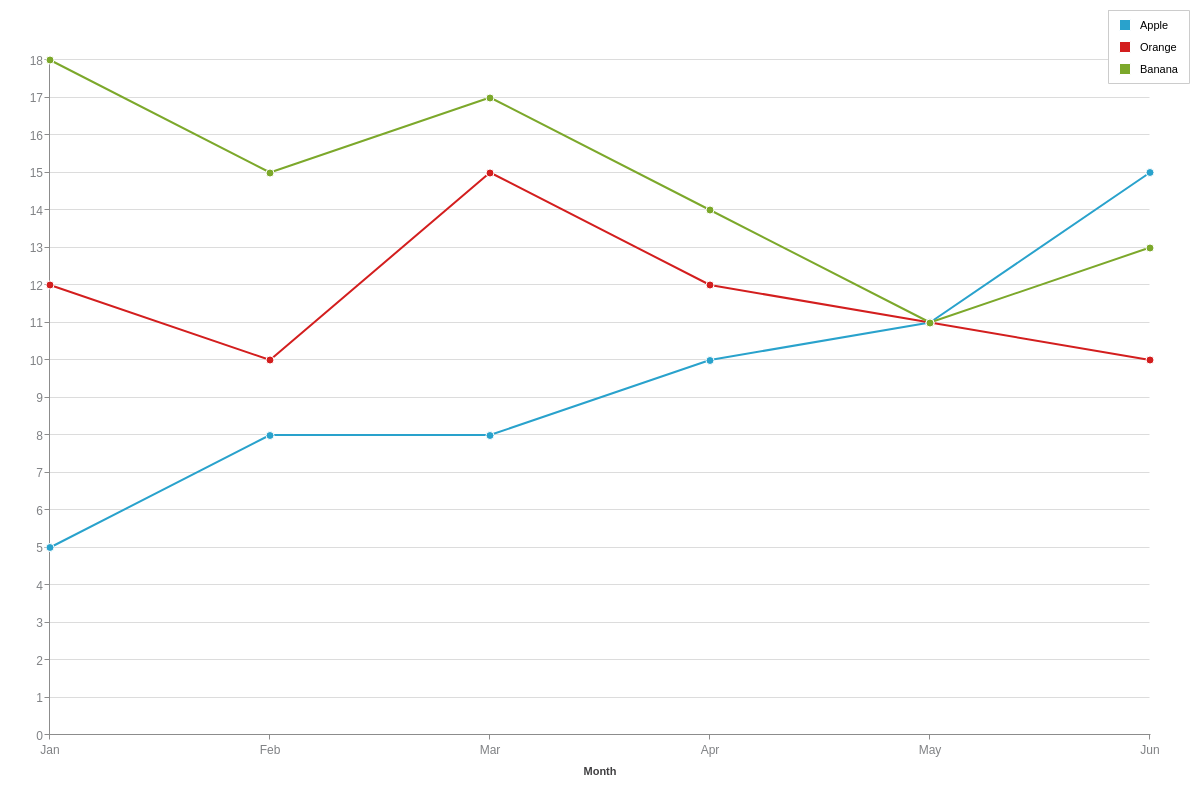
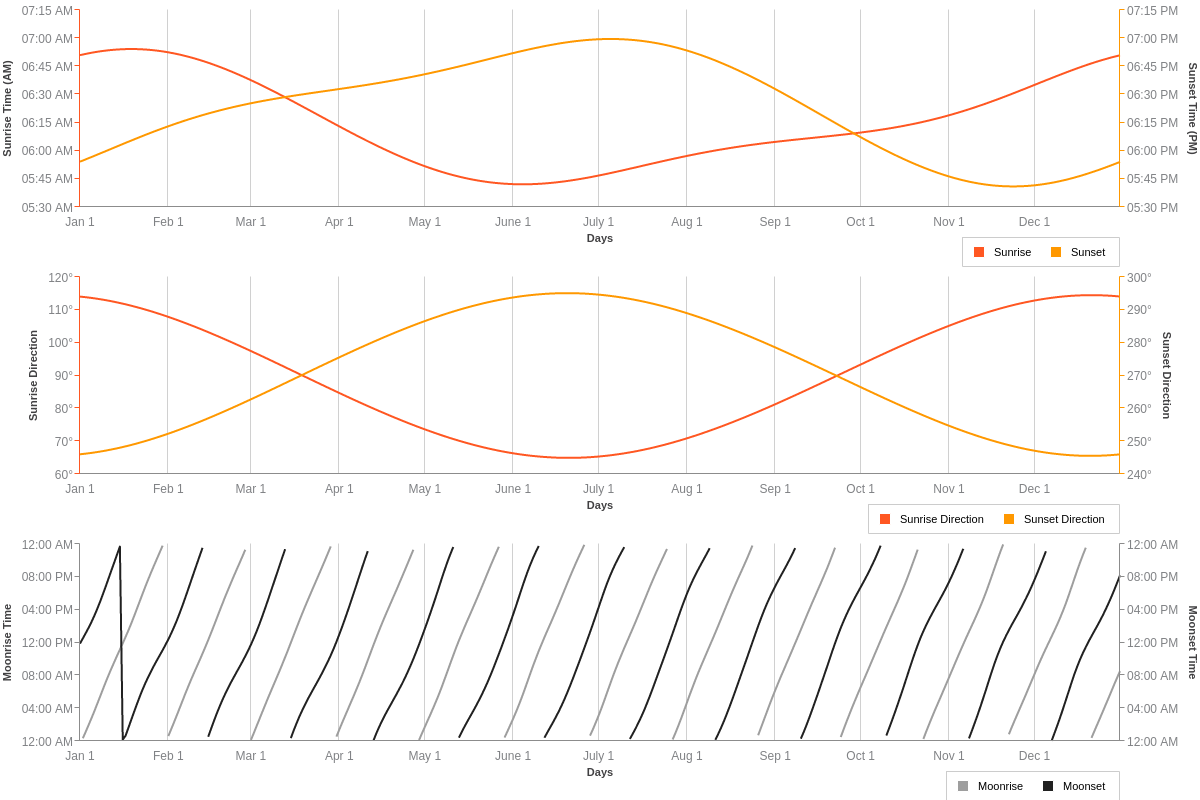
Smart-Scales
The "smart-scales" attribute attempts to group plot values on different y-scales in order to avoid combining drastically different values on a single scale. This allows smaller values to be easier to distinguish from each other.
csv: {
    url: "./resources/company.csv",
    'vertical-labels': true,
    'smart-scales': true
}
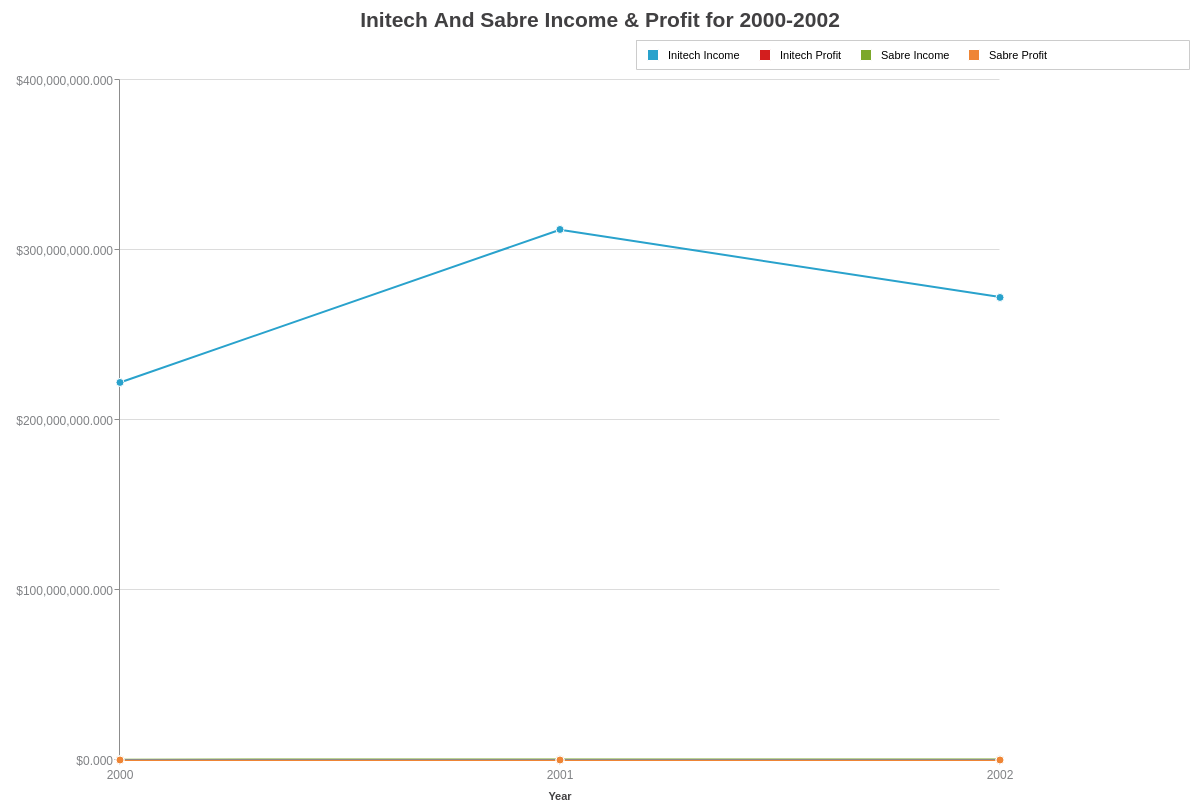
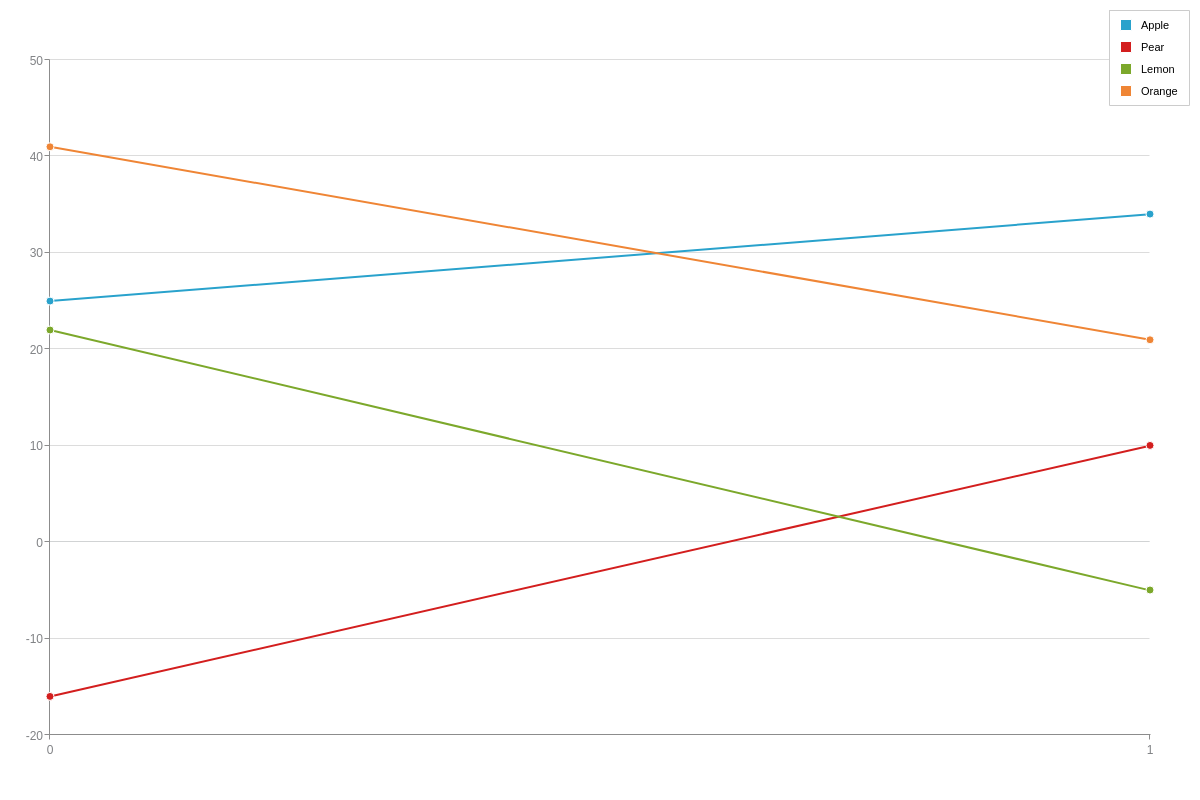
When the "smart-scales" attribute is set to false, the library does not provide the necessary scales.
csv: {
    url: "./resources/company.csv",
    'vertical-labels': true,
    'smart-scales': false
}
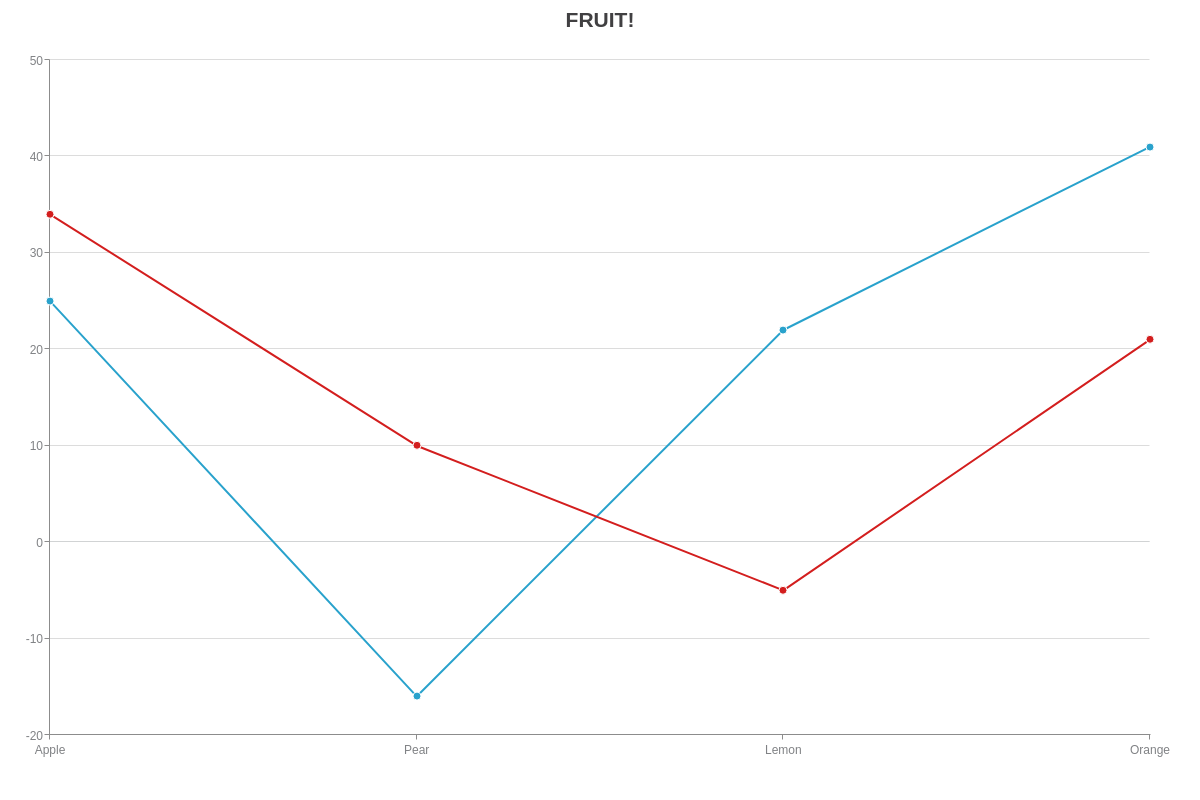
Setting Titles
The library automatically looks at the data to decide if the first line is intended to be a title or not. If it thinks it is, then the first line will become the title of the graph.
csv: {
    url: "./resources/fruittitle.csv"
}
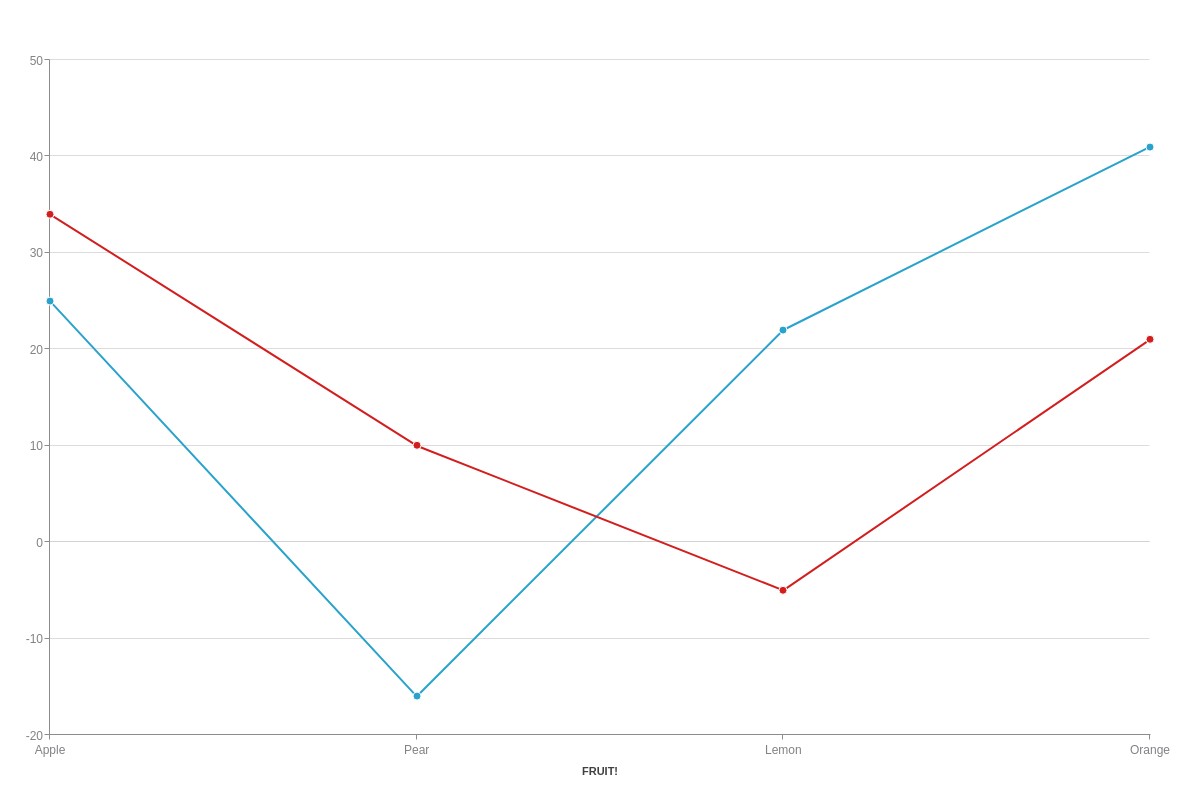
However, if there is a title line in the CSV and title: "false" is specified, then the first line will become a scale label.
csv: {
    url: "./resources/fruittitle.csv",
    title: false
}
Setting Labels
If the first column of your CSV file contains labels, the "vertical-labels" attribute allows you to import the first column as labels.
csv: {
    url: "./resources/fruitlabels.csv",
    'vertical-labels': true
}

If the first row (or second row if your CSV contains what seems to be a title) contains labels, the "horizontal-labels" attribute will import that row as labels.
csv: {
    url: "./resources/fruitlabels.csv",
    'horizontal-labels': true
}
Mirroring CSV Data
Setting the "mirrored" attribute to true will tell the library to treat rows as columns and vice versa. Be careful, as you may have to reconfigure your CSV data to make sense when setting "mirrored" to true.
csv: {
    url: "./resources/fruit.csv",
    mirrored: true
}
For a list of available attributes, please visit our Graph Objects CSV JSON Syntax page.
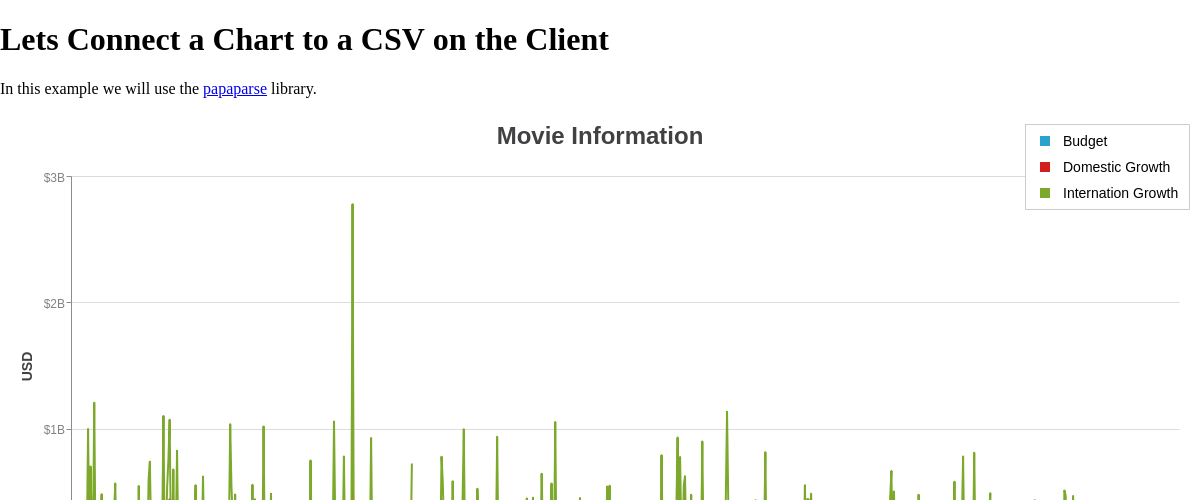
Custom CSV File Parse
Sometimes, your format of your CSV file doesn't fit our CSV standards. Maybe it's out of your hands to change the format. It's also quite possible you only want certain columns from your CSV file but not all the columns. The following demo shows how one might parse a CSV file.
papaparse
Using a third party CSV parser is recommended when catering to a highly custom solution.
Vanilla JS
The following demo(s) show how you might parse a CSV file using native JavaScript.
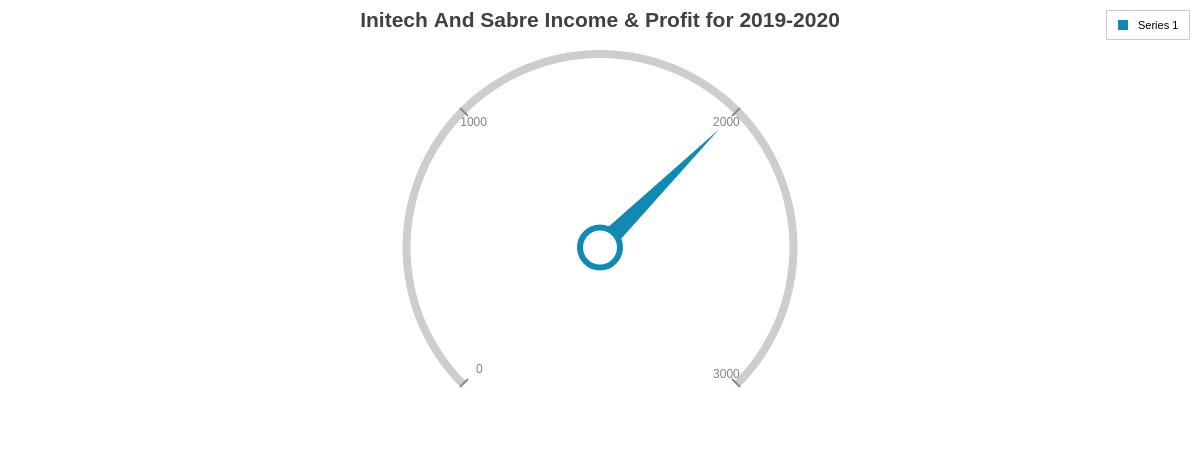
Demo
Summary
Using CSV files is an effective method for entering data into your chart. By using external data sources, you limit the amount of work required to update your charts when your data changes.
Don't forget, a comprehensive list of available attributes and objects can be found on our JSON Syntax page.