Performance
Overview
Performance should always be a concern, but as you get into larger datasets (20k+ nodes), the chart will definitely slow down. How do we combat this? What constitutes a good solution? Let's go over some of the basic performance concerns and how we can address them.
Data Types
The type of data you input to the chart can have drastic performance implications. If you are plotting multi-dimensional data, there will definitely be a slow down.
2D Array
If you are rendering your data as a 2D array of values, then the chart will at the very least render at n^2 speed. This
data format is typical if you are using data in the form [x,y] or [timestamp,value]. We consider this data to have
an irregular step, meaning the interval (step) is not identical from node to node.
Note: If your data is multi-dimensional but the step is consistent (e.g once every second), you do not need multi-dimensional data. You can use a single dimensional array and set your `scaleX.step` value in the initial chart configuration.
Solution
There is no straightforward solution to performance. With that said, there are some basic steps you can take to achieve a relative performance gain, such as any combination of the following methodologies.
Defer Load
You can defer the loading of data in your chart by rendering an empty series object and giving your
chart configuration a noData object to inform the user data is on the way. You can batch in data
asynchronously after this.
let chartConfig = {
  type: 'area',
  noData: {
    text: 'No data found',
    backgroundColor: '#efefef'
  },
  // if fetching data remotely define an empty series
  series: [{}]
};
JSON Attributes
There are several attributes which enhance aspects of the render speed. These attributes are the main
performance features located in the plot object.
plot: {
  exact:true, // is recommended when you want the chart to paint ALL nodes and not sample your data
  smartSampling: true, // smart sample and render data
  hintTs: true, // tells the library you have timestamps as keys and activates a small optimization technique
  maxNodes: 150, // max nodes to have event listeners for eg) tooltips wont show but crosshair will
  maxTrackers: 150, // will disable the hover active areas you have for markers (again, 60k) since you use crosshair tool anyway
}
Sampling
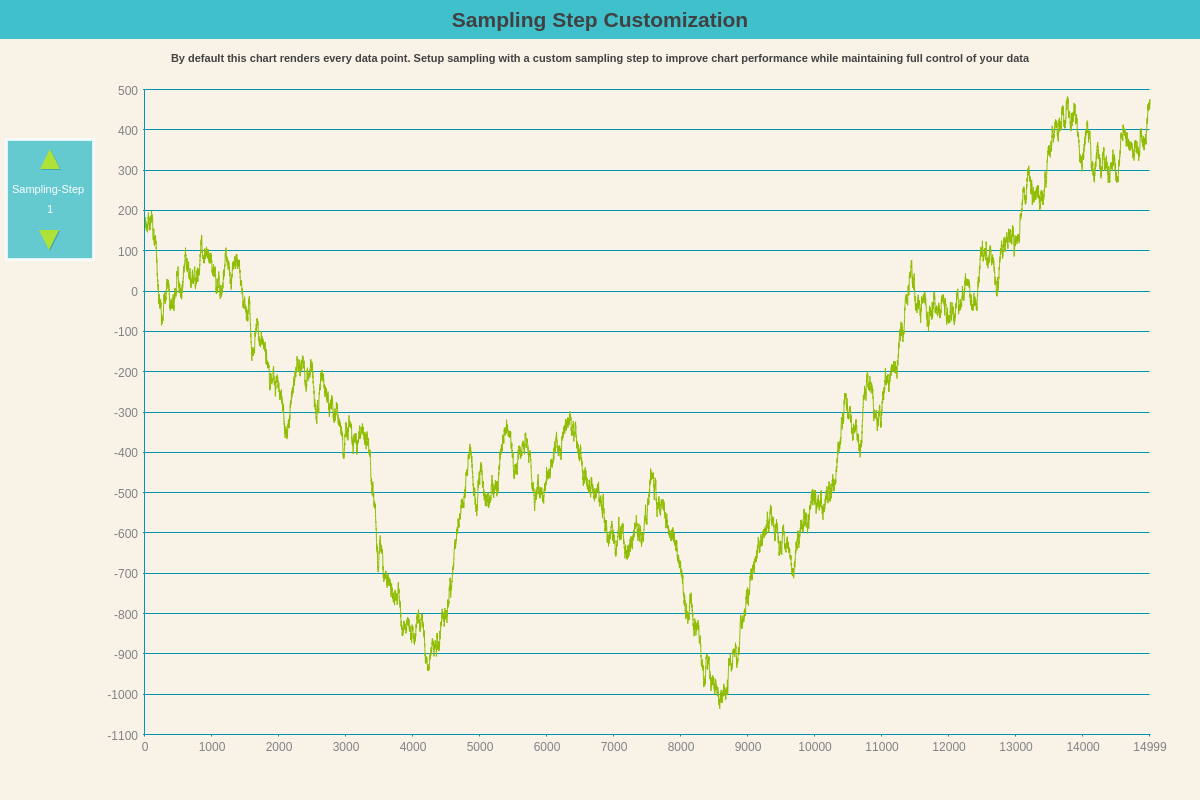
You can sample data on the chart to increase performance. When you have a large dataset chart, we recommend sampling. You can drill down into granular data by zooming and smart sampling will turn off as you zoom in more and more.
plot: {
  exact: false,
  smartSampling: true,
  sampleStep: 1, // scroll step 1 is not sampling. Setting this this value to 2 will sample every other data point
  scrollStepMultiplier: 5 // as you scroll the chart sampling data in live preview
}

ZingChart Globals
Below is a small list of attributes which will help the parse/render process. You can view the full details in our zingchart object docs.
// defined ABOVE the render and sets flags
// globally for ALL charts on a page
zingchart.DEV.CACHECANVASTEXT = true;
zingchart.DEV.CHECKDECIMALS = false;
zingchart.DEV.CACHESELECTION = true;
zingchart.DEV.MEDIARULES = false;
zingchart.DEV.SKIPTRACKERS = true;
// skips the intro loading screen (most likely invisible to human eye anyway)
zingchart.DEV.SKIPPROGRESS = true;
// indicates to the lib that there are no external resources to load (images)
zingchart.DEV.RESOURCES = false;
// prevents lib from storing the original data package
zingchart.DEV.KEEPSOURCE = false;
// prevents lib from creating a copy of the data package instead of working with the provided one (which can be altered)
zingchart.DEV.COPYDATA = false;
// forces the library to accept only long tokes (e.g., %node-value instead of %v) saving some parsing time
zingchart.DEV.SORTTOKENS = false;
// skips calculations of several plot relates statistics (min, max, sum, avg values)
zingchart.DEV.PLOTSTATS = false;
// tells library dashed syntax only is used so there is no conversion (saves time for large JSON's)
zingchart.SYNTAX = 'dashed';
Render Type
The render method is where you can define the output, which can either render Canvas or SVG.
If you are rendering a large dataset, the performance of Canvas will benefit you because
DOM explosion happens when rendering in SVG.
// render the chart right away
zingchart.render({
  id: 'myChart',
  data: myConfig,
  height: '100%',
  width: '100%',
  output: 'canvas',
});