Your First JavaScript Chart
Overview
This guide is meant to be quick and take no longer than a couple minutes. You'll learn how to download, import and render your first ZingChart. Let's get started!
Download the Library
There are several ways to download the library. All of these methods require you to execute our library in a script tag on the page.
CDN Link
For the quickest setup, use the CDN link to import the library.
<script src="https://cdn.zingchart.com/zingchart.min.js"></script>
Direct Download
For the quickest setup, use the CDN link to import the library.
The second option is to download ZingChart from our site or our public GitHub repository.
Directly download the library zip here.
<script src="/zingchart/zingchart.min.js" defer></script>
NPM Install
You can use the command npm install to download the
ZingChart package to your repository. If you are accessing it with
imports, the following syntax will work:
zingchart/es6
version of the library. You can see modules being
explicitly loaded by their full path in the
download package.
  import {zingchart, ZC} from 'zingchart/es6'; // to import the pareto chart module
import 'zingchart/modules-es6/zingchart-pareto.min.js';
Referencing the Library
To use the library, you need to reference the script into your
environment. Since we are using the CDN link, we'll just add it to the
<head> tag.
  <!DOCTYPE html>
<html>
 <head>
  <!-- Script  Reference[1] -- >
   <script src="https://cdn.zingchart.com/zingchart.min.js"></script>
 </head>
 <body>
  <!-- Chart Placement[2] -->
  <div id="myChart"></div>
 </body>
</html>
Rendering the Chart
Making your first chart is as simple as creating a
<div> tag and adding an id attribute.
This <div> container is where we will bind the chart
on render.
zingchart.render()
The chart rendering is done through the
zingchart.render({...}) method. The minimum requirements
for this method are the id and
data properties.
  // Render Method[3]
zingchart.render({
  id: 'myChart',
  data: myConfig,
});
Chart Configuration
You add features to the library through attributes. The minimum
attributes to render a chart are the type and
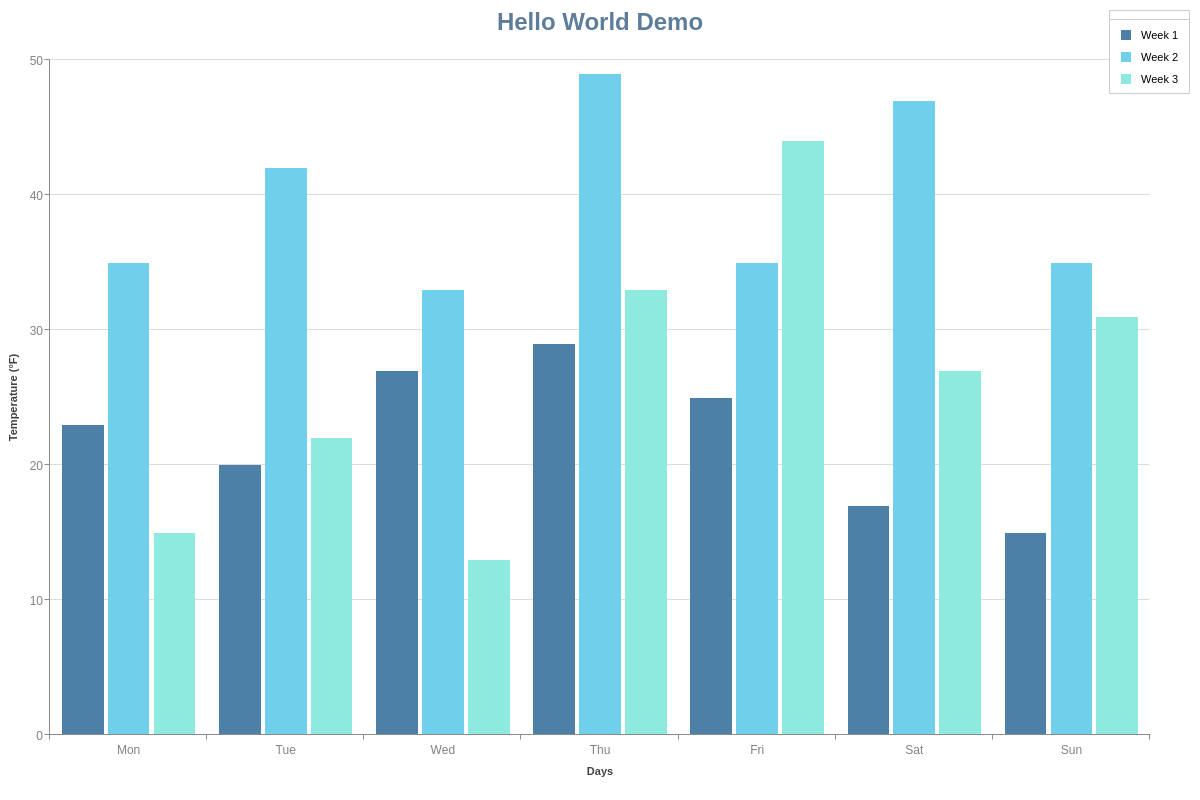
series attributes. In this getting started example,
myConfig is a JavaScript object:
  let myConfig = {
type: 'bar',
title: {
  text: 'Data Basics',
  fontSize: 24,
},
legend: {
  draggable: true,
},
scaleX: {
  // Set scale label
  label: { text: 'Days' },
  // Convert text on scale indices
  labels: [ 'Mon', 'Tue', 'Wed', 'Thu', 'Fri', 'Sat', 'Sun' ]
},
scaleY: {
  // Scale label with unicode character
  label: { text: 'Temperature (°F)' } },
  plot: {
    // Animation docs here:
    // https://www.zingchart.com/docs/tutorials/styling/animation#effect
    animation: {
      effect: 'ANIMATION_EXPAND_BOTTOM',
      method: 'ANIMATION_STRONG_EASE_OUT',
      sequence: 'ANIMATION_BY_NODE',
      speed: 275,
    }
},
series: [
  {
    // plot 1 values, linear data
    values: [23,20,27,29,25,17,15],
    text: 'Week 1',
   },
  {
    // plot 2 values, linear data
    values: [35,42,33,49,35,47,35],
    text: 'Week 2'
   },
  {
    // plot 3 values, linear data
    values: [15,22,13,33,44,27,31],
    text: 'Week 3'
  }
 ]
};
Moving Forward
You can view the whole example in the code snippet below or follow the demo link to our studio and follow along with other examples in our getting started docs.
Demo
Full HTML
  <!DOCTYPE html>
<html>
<head>
  <!--Script Reference[1] -->
  <script src="https://cdn.zingchart.com/zingchart.min.js"></script>
</head>
<body>
  <!-- Chart Placement[2] -->
  <div id="myChart"></div>

  <script>
  let myConfig = {
    type: 'bar',
    title: {
      text: 'Data Basics',
      fontSize: 24,
    },
    legend: {
      draggable: true,
    },
    scaleX: {
      // Set scale label
      label: { text: 'Days'},
      // Convert text on scale indices
      labels: [ 'Mon', 'Tue', 'Wed', 'Thu', 'Fri', 'Sat', 'Sun' ]
    },
    scaleY: {
      // Scale label with unicode character
      label: { text: 'Temperature (°F)' }
    },
    plot: {
      // Animation docs here:
      // https://www.zingchart.com/docs/tutorials/styling/animation#effect
      animation: {
        effect: 'ANIMATION_EXPAND_BOTTOM',
        method: 'ANIMATION_STRONG_EASE_OUT',
        sequence: 'ANIMATION_BY_NODE',
        speed: 275,
      }
    },
    series: [
      {
        // Plot 1 values, linear data
        values: [23,20,27,29,25,17,15],
        text: 'Week 1',
      },
      {
        // Plot 2 values, linear data
        values: [35,42,33,49,35,47,35],
        text: 'Week 2'
      },
      {
        // Plot 3 values, linear data
        values: [15,22,13,33,44,27,31],
        text: 'Week 3'
      }
    ]
   };

   // Render Method[3]
   zingchart.render({
     id: 'myChart',
     data: myConfig,
   });
 </script>
</body>
</html>
Notes
- Script Reference - The main ZingChart script reference includes the vast majority of our chart types and features. A few of our more advanced options (e.g., Map charts, dragging tool, selection tool, 3D toolbar) do require the addition of individual module scripts. For more information, see our Modules page.
- Chart Placement - The template starts you off with a single chart. To add a second (or more) charts, see our Adding Additional Charts page.
-
Render Method - This is where your chart is rendered
with its corresponding data. The element id
myChartand datachartConfigis specified here. Within your render method, you can also adjust your chart's height, width, and rendering type (SVG or canvas). See our Render Options page for more information. - Advanced Developers: Download the ZingChart library or get it from GitHub, and then place the scripts in your working directory.