3D Charts
Overview
ZingChart offers a variety of 3D JavaScript chart types, along with the ability to control how the chart is displayed with 3D type, angle, depth, and zoom.
Be careful when using 3D charts - adding a third dimension obscures your data and makes your chart more difficult to decipher as a user. In almost all cases, we recommend using 2D charts over 3D charts. Have any questions? Reach out to our data viz experts in the chat below.
3D Chart Types
The first step to creating JavaScript 3D charts is to specify a 3D chart type.
The available 3D chart types are:
| Value | Description |
|---|---|
area3d |
3D Area |
bar3d |
3D Bar |
hbar3d |
3D Horizontal Bar |
line3d |
3D Line |
mixed3d |
3D Mixed Charts |
pie3d |
3D Pie |
ring3d |
3D Donut |
waterfall3d |
3D Waterfall |
hwaterfall3d |
3D Horizontal Waterfall |
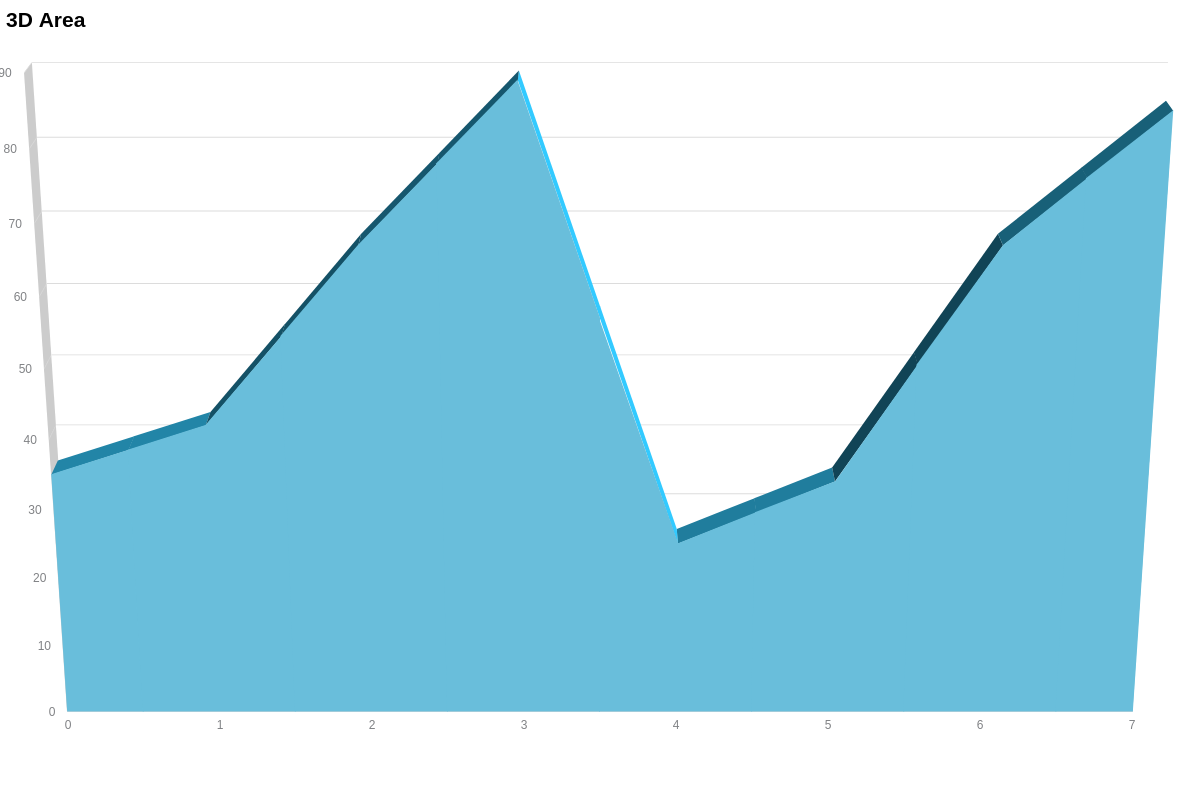
3D Area Chart
3D area charts are specified by the area3d value.
Note: Use the alpha-area attribute to adjust the transparency levels to ensure all the data in the series is visible.
{
  type: area3d,
  plot: {
    'alpha-area': 0.7
  }
}
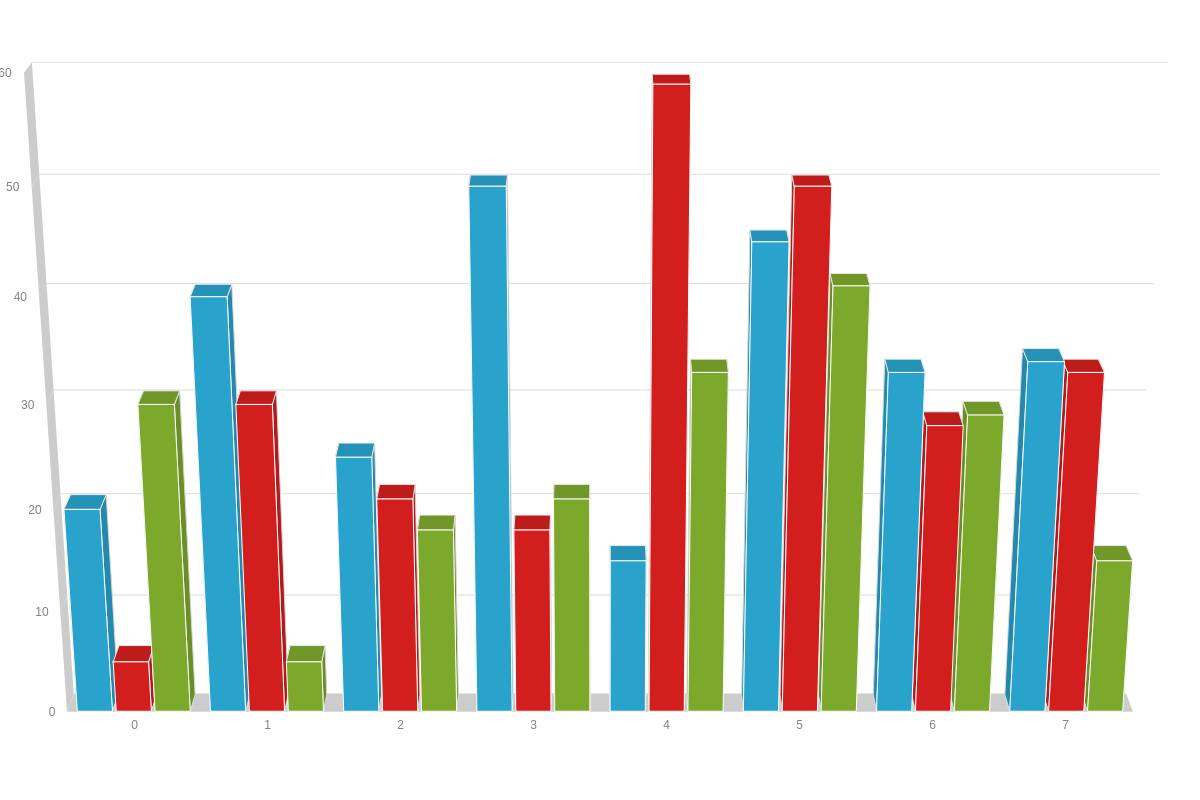
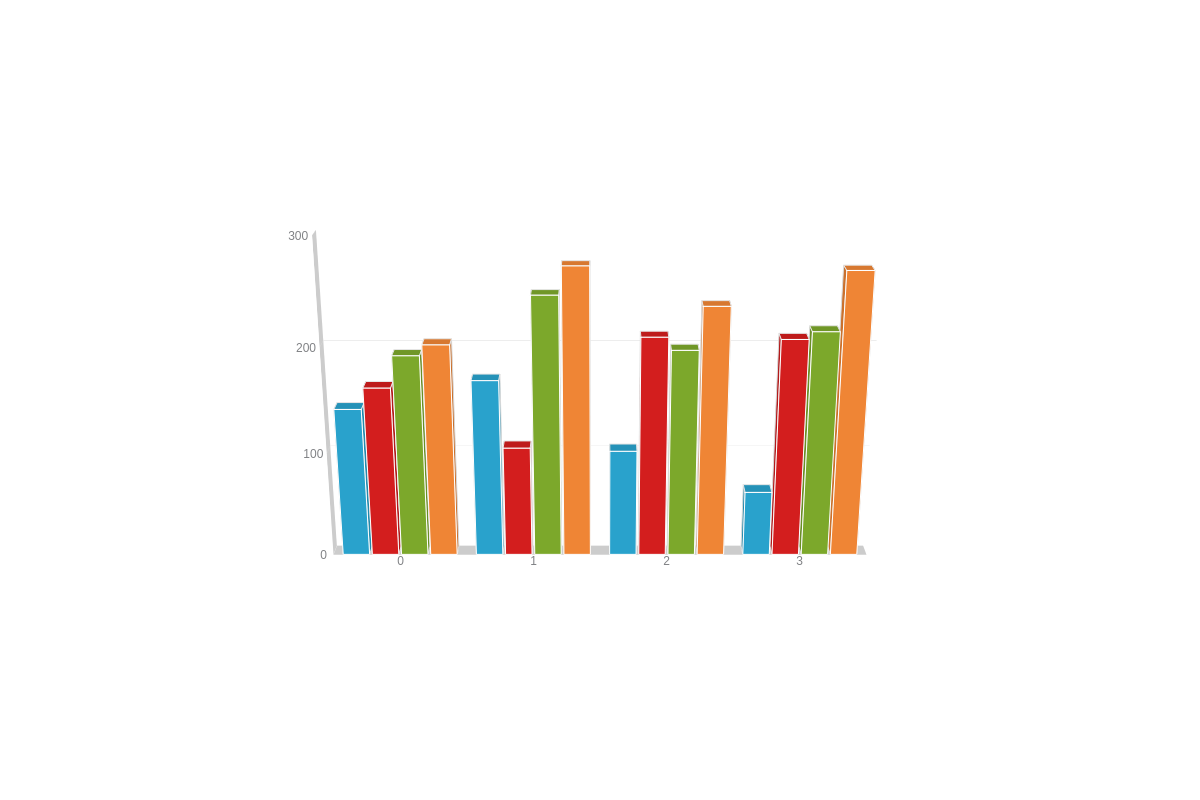
3D Bar Chart
3D bar charts are specified by the bar3d or vbar3d value. The bars are vertically oriented.
{
  type: 'bar3d' /* or 'vbar3d' */
}
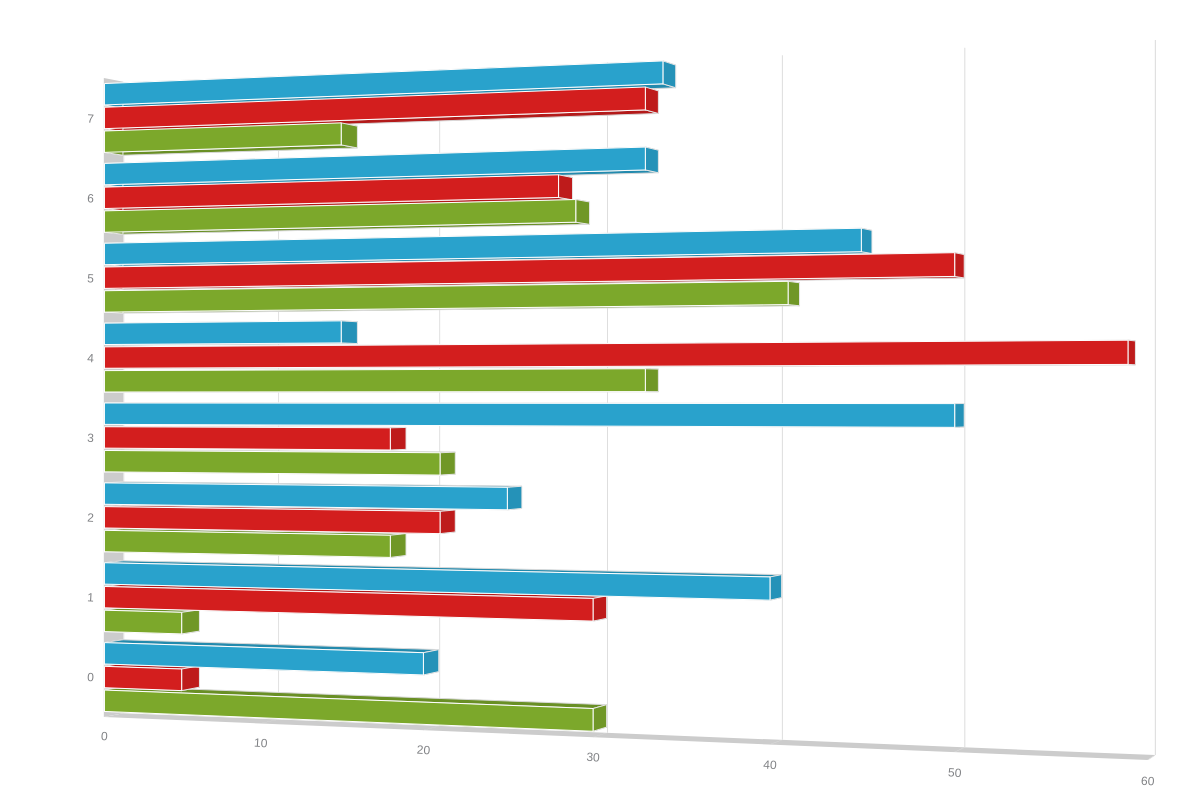
3D Horizontal Bar Chart
3D horizontal bar charts are specified by the hbar3d value.
{
  type: 'hbar3d'
}
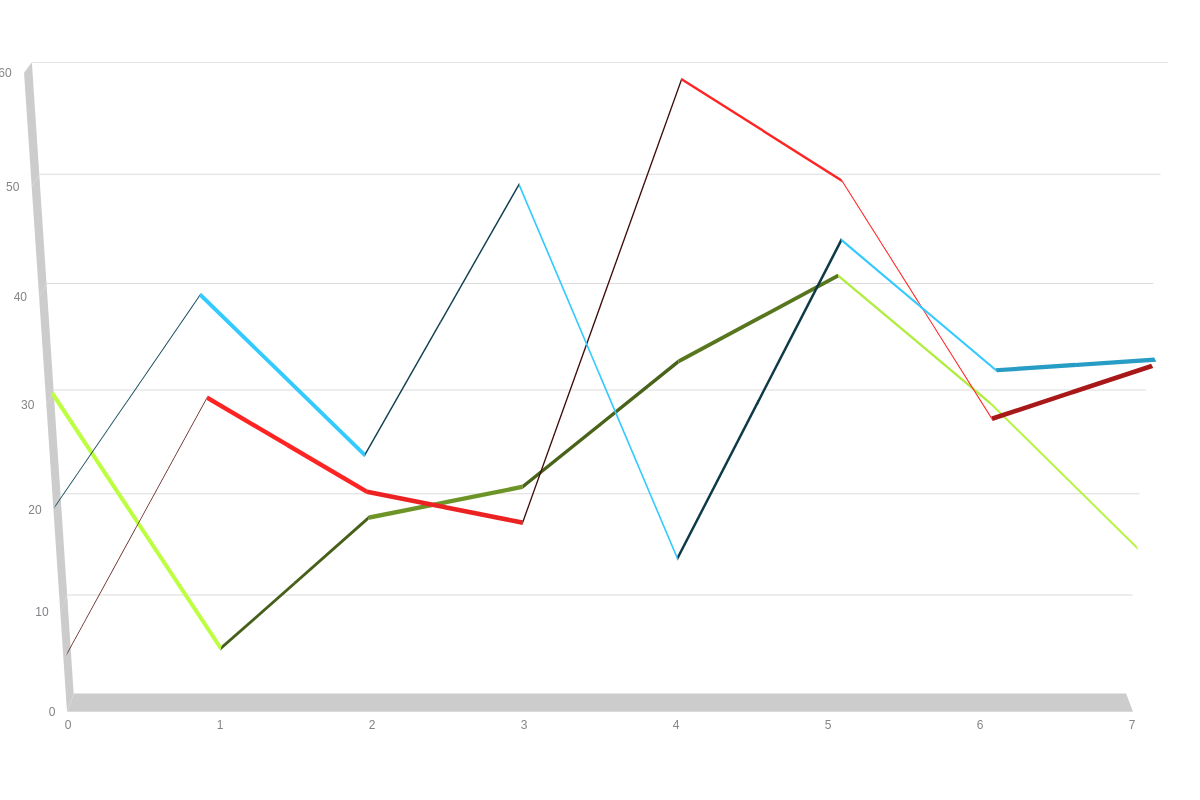
3D Line Chart
3D line charts are specified by the line3d attribute.
{
  type: 'line3d',
}
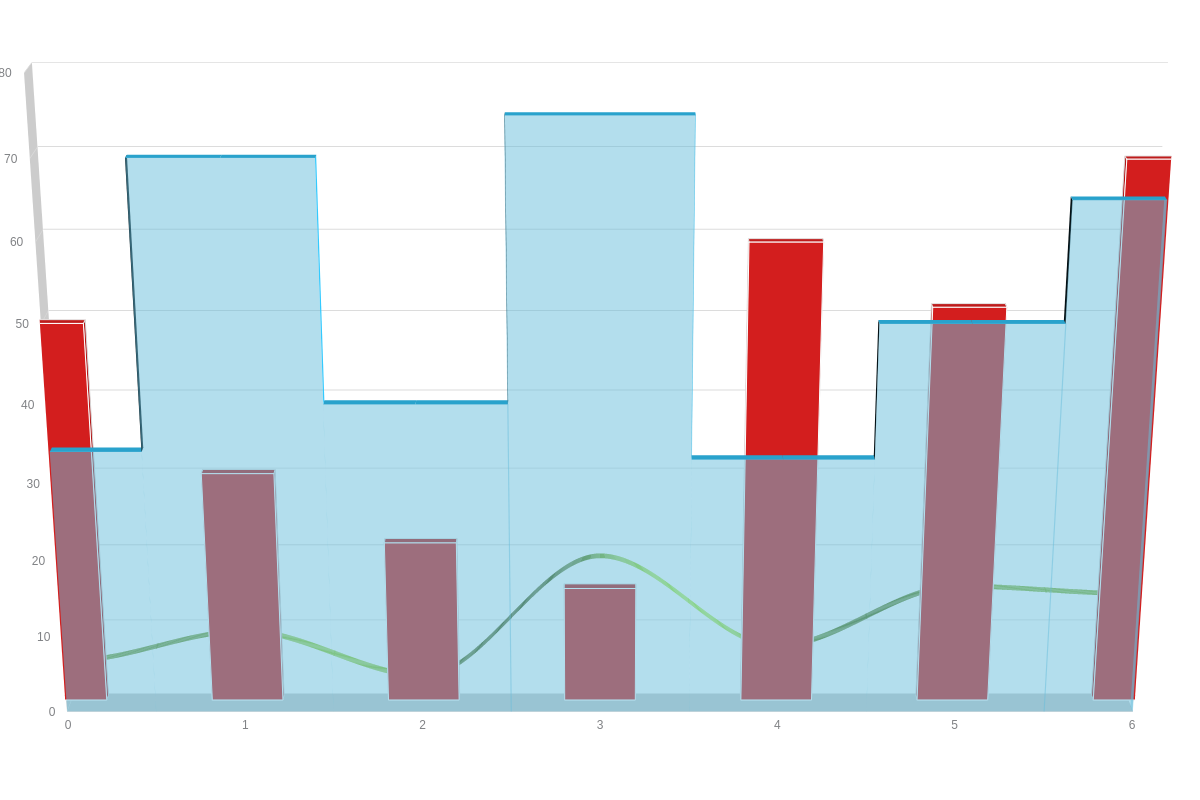
3D Mixed Chart
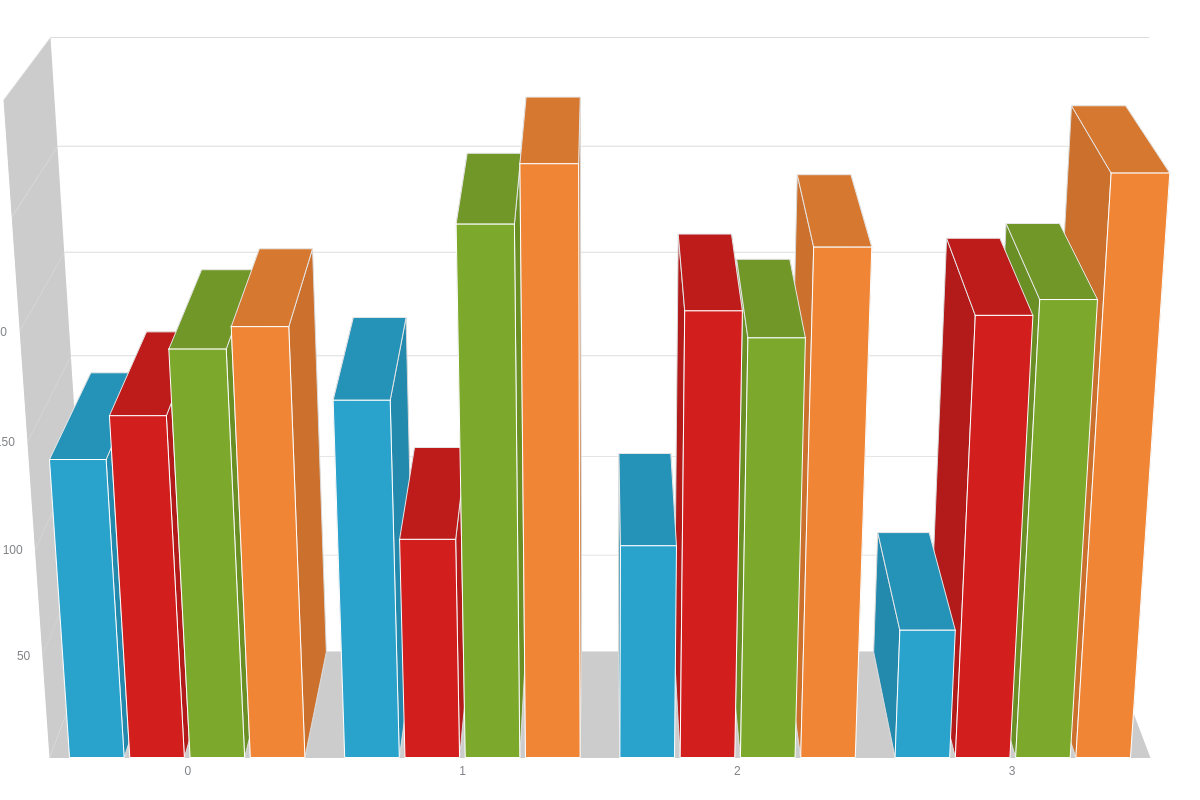
The three-dimensional mixed chart is specified by the mixed3d value. You can use the area3d, bar3d, and line3d chart types with our 3D mixed charts, as seen in the example chart below:
{
  type: 'mixed3d', // 1. Specify your mixed chart type.
  plot: {
    tooltip: {
      text: '%t'
    }
  },
  series: [ // 2. Specify the chart type for each series object.
    {
      type: area3d,
      values: [34, 70, 40, 75, 33, 50, 65],
      aspect: 'stepped',
      contourOnTop: false,
      alphaArea: 0.5,
      text: 'Area Chart'
    },
    {
      type: bar3d,
      values: [49, 30, 21, 15, 59, 51, 69],
      barWidth: '50%',
      text: 'Bar Chart'
    },
    {
      type: line3d,
      values: [5, 9, 3, 19, 7, 15, 14],
      aspect: 'spline',
      text: 'Line Chart'
    }
  ]
}
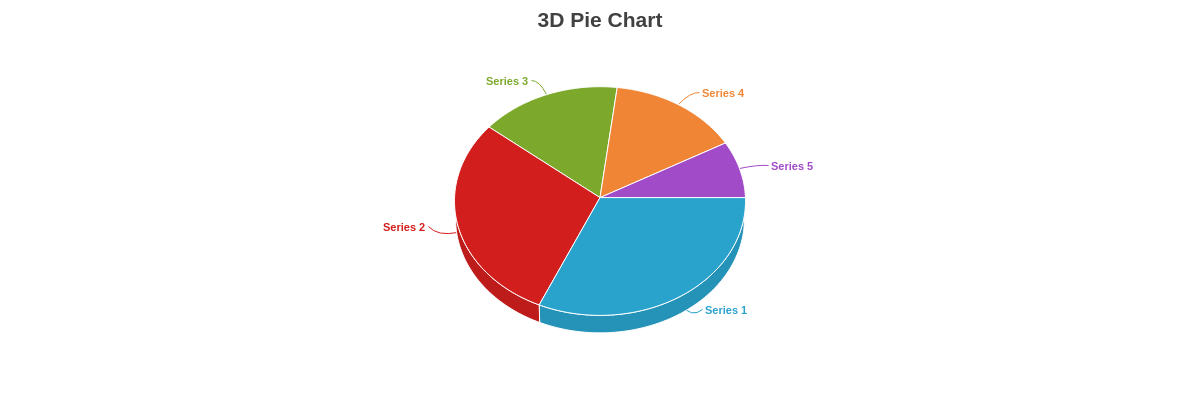
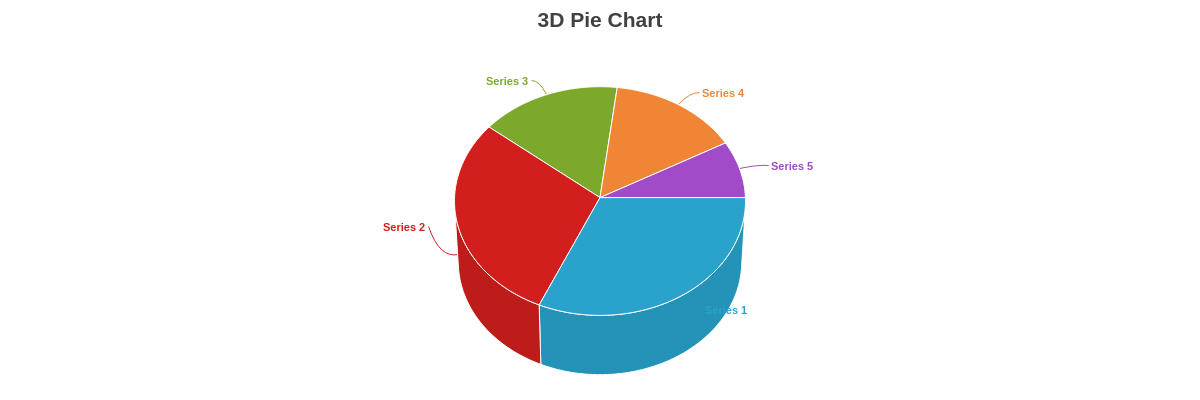
3D Pie Chart
Our three-dimensional pie chart is specified by the pie3d value.
{
  type: 'pie3d',
}
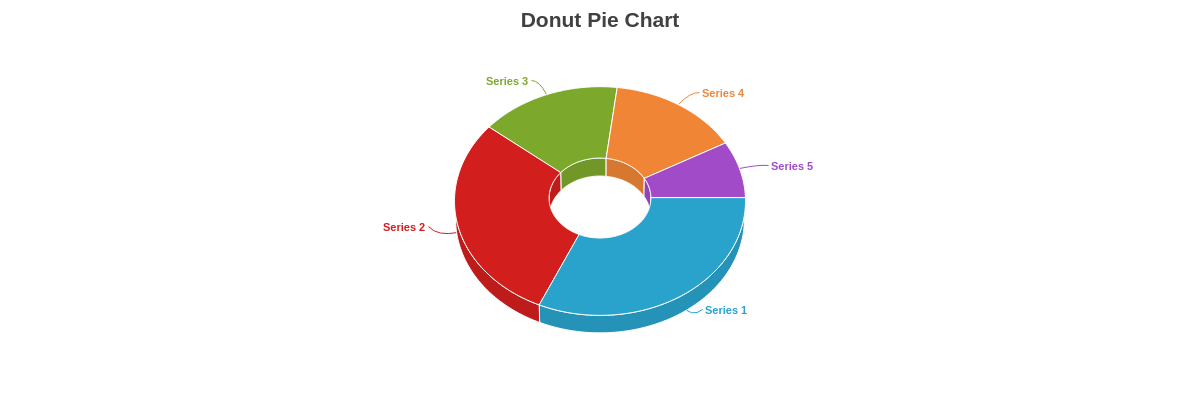
3D Donut Chart
The three-dimensional donut chart is specified by the ring3d value.
Note: You can modify the donut ring size. Create a plot object and insert a slice attribute. Specify your desired ring size as a percentage or pixel value.
{
  type: 'ring3d',
}
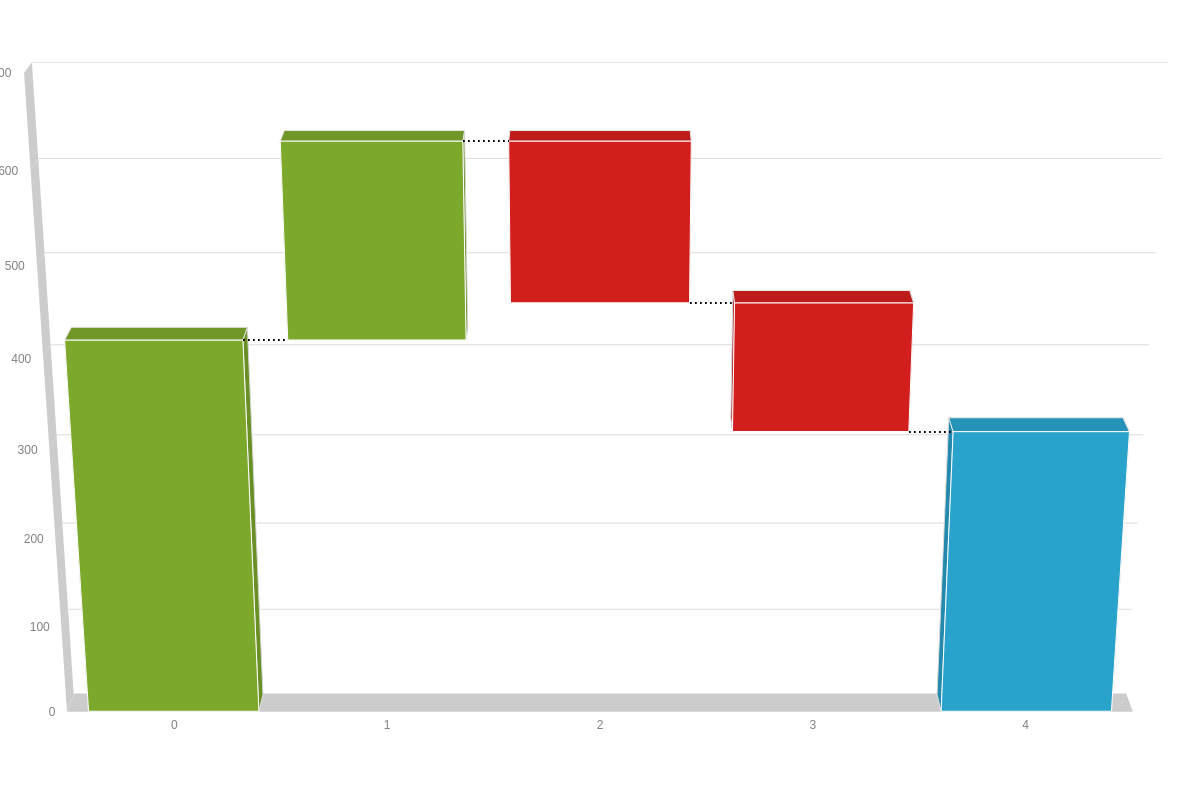
3D Waterfall Chart
The three-dimensional waterfall chart is specified by the waterfall3d value.
{
  type: 'waterfall3d',
}
3D Horizontal Waterfall Chart
The three-dimensional horizontal waterfall chart is specified by the hwaterfall3d value.
{
  type: 'hwaterfall3d',
}
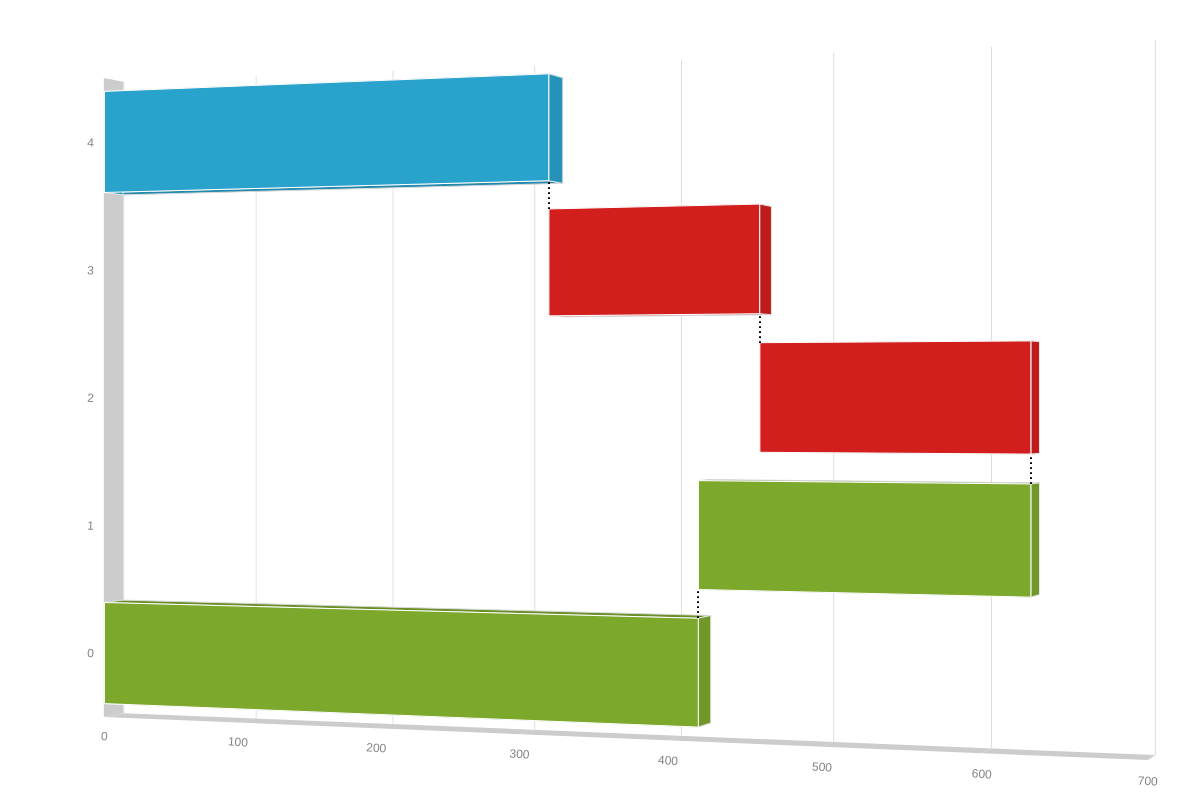
Chart-Specific Properties
Further modify your 3D charts with the following attributes.
3D Chart Aspects
To use the 3D attributes in your chart, you must first create a "3d-aspect" object where you can specify which type of 3D aspect to use.
'3d-aspect': {
  }
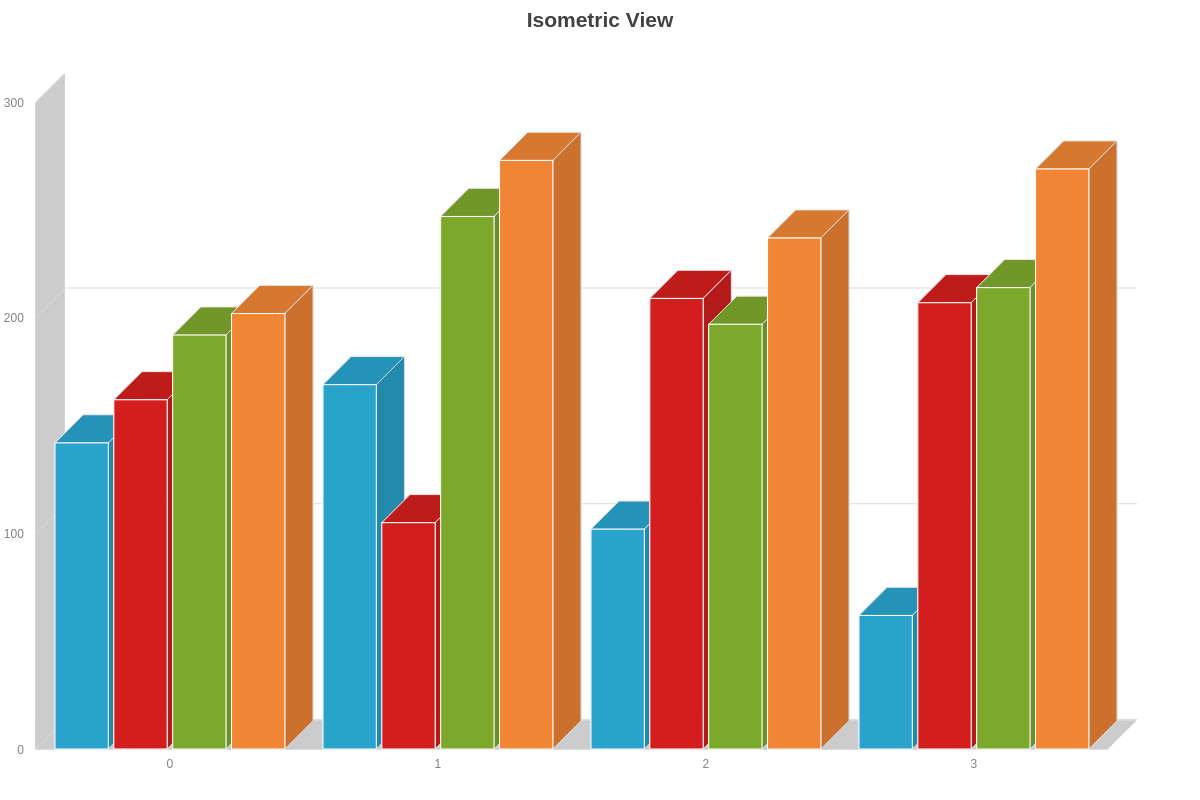
True 3D vs Isometric
The "true3d" attribute can be set to true or false. By default, it is set to true.
By setting "true3d" to true, the chart will use a true 3D engine. This will give you access to the perspective and control of the x, y and "z" properties. Setting it to false will force an isometric view, which is a 2D representation of three dimensions. This view has no perspective.
type: bar3d,
  '3d-aspect': {
    true3d: false
  }
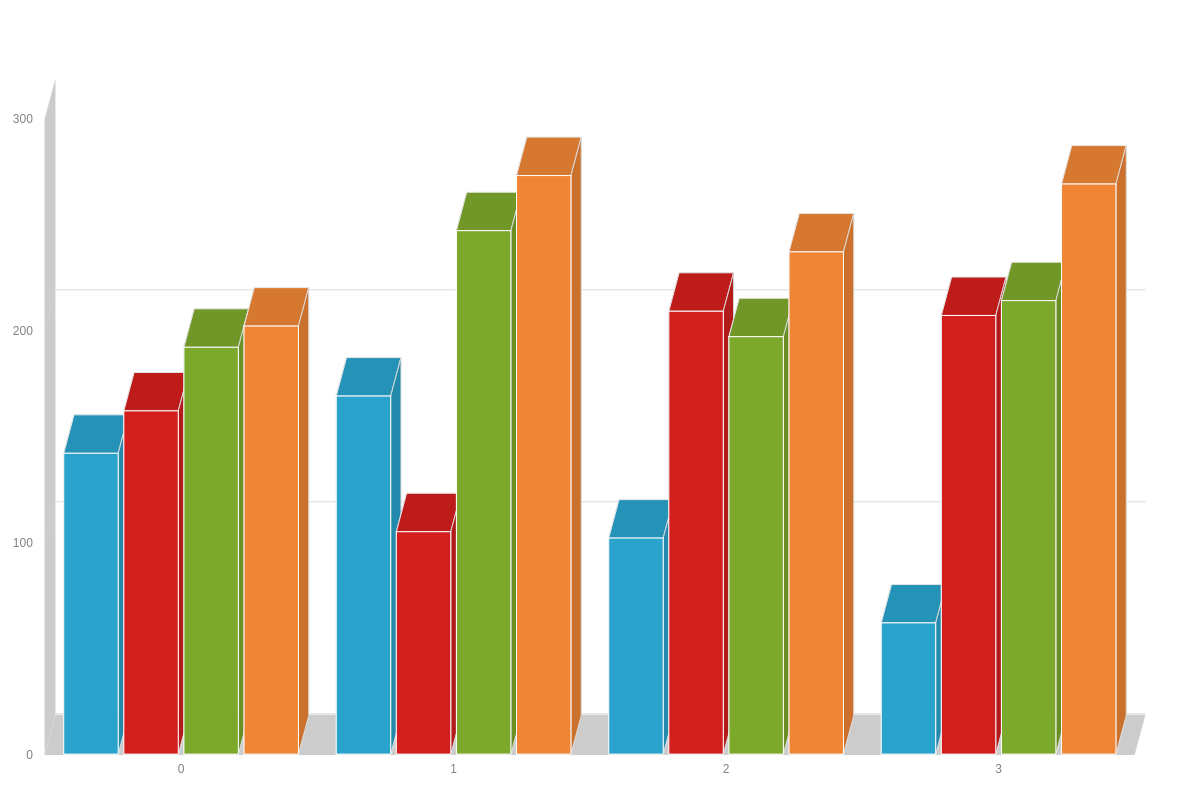
Angle
When you are using the isometric view, you have the option of setting the angle perspective by using the "angle" attribute. By default, the angle is set to 45 degrees. You can set it to be any value between 0 and 90.
type: bar3d,
    '3d-aspect': {
      true3d: false,
      angle:75
    }
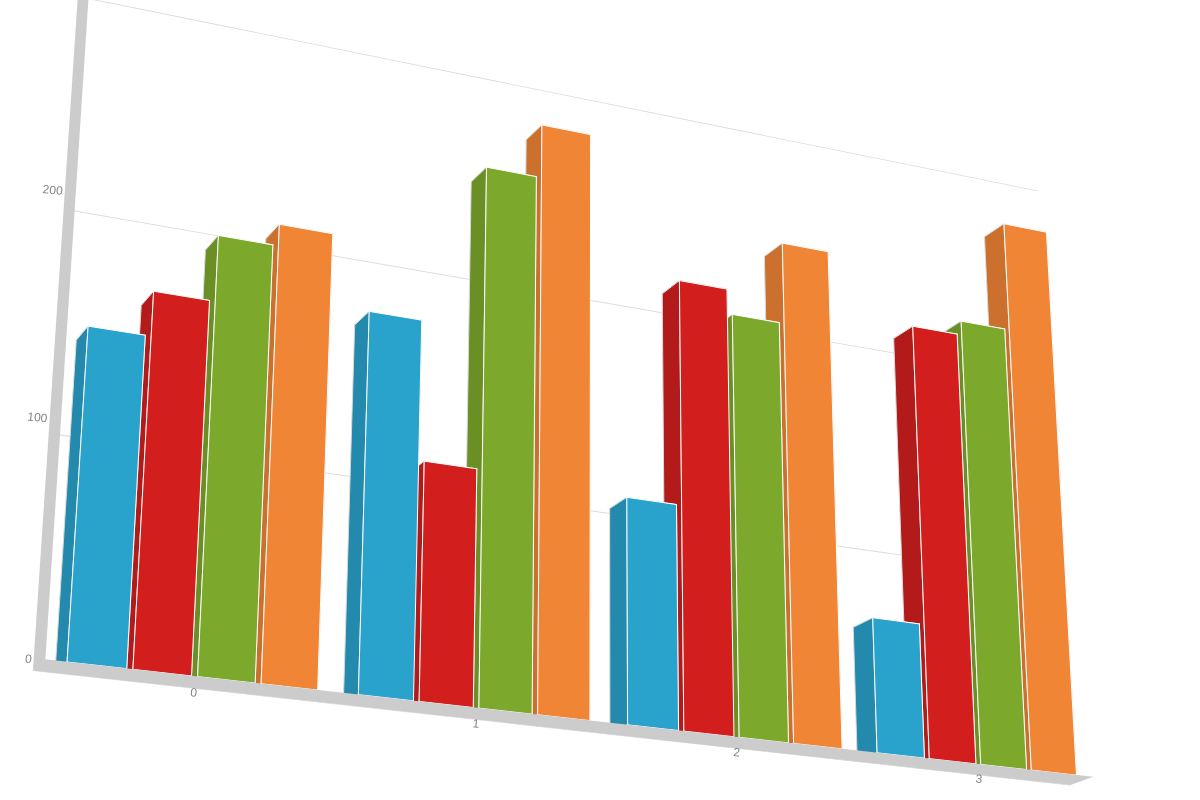
When you are using the true 3D view, it will use a true 3D engine, allowing you to use the x, y and "z" properties.
type: 'bar3d',
  '3d-aspect': {
    xAngle: 20,
    yAngle: 25,
    zAngle: 0
  }
Depth
The "depth" attribute is used to specify the depth on the z-axis and can be used in either isometric or true 3D.
type: 'bar3d',
  '3d-aspect': {
    depth: '75px'
  }
Facets
"Facets" is a plot/series object, meaning it can be placed within the "plot" object, where it will have the same effect on every plot object in a chart, or within each object in the "series" array. When placed in a series object, it will only affect that series, allowing you to apply a different style to each.
3D objects are made up of front, left, right, top, and bottom sections. As such, these terms are used within the "facets" object to style each section.
plot: {
  facets: {
    front: {
      'backgroundColor': '#3EA4F9 #0055BF'
    },
    right: {
      'backgroundColor': '#3EA4F9 #0055BF'
    },
    left: {
      'backgroundColor': '#3EA4F9 #0055BF'
    },
    top: {
      'backgroundColor': 'white'
    },
    bottom: {
      'backgroundColor': 'white'
    }
  }
},
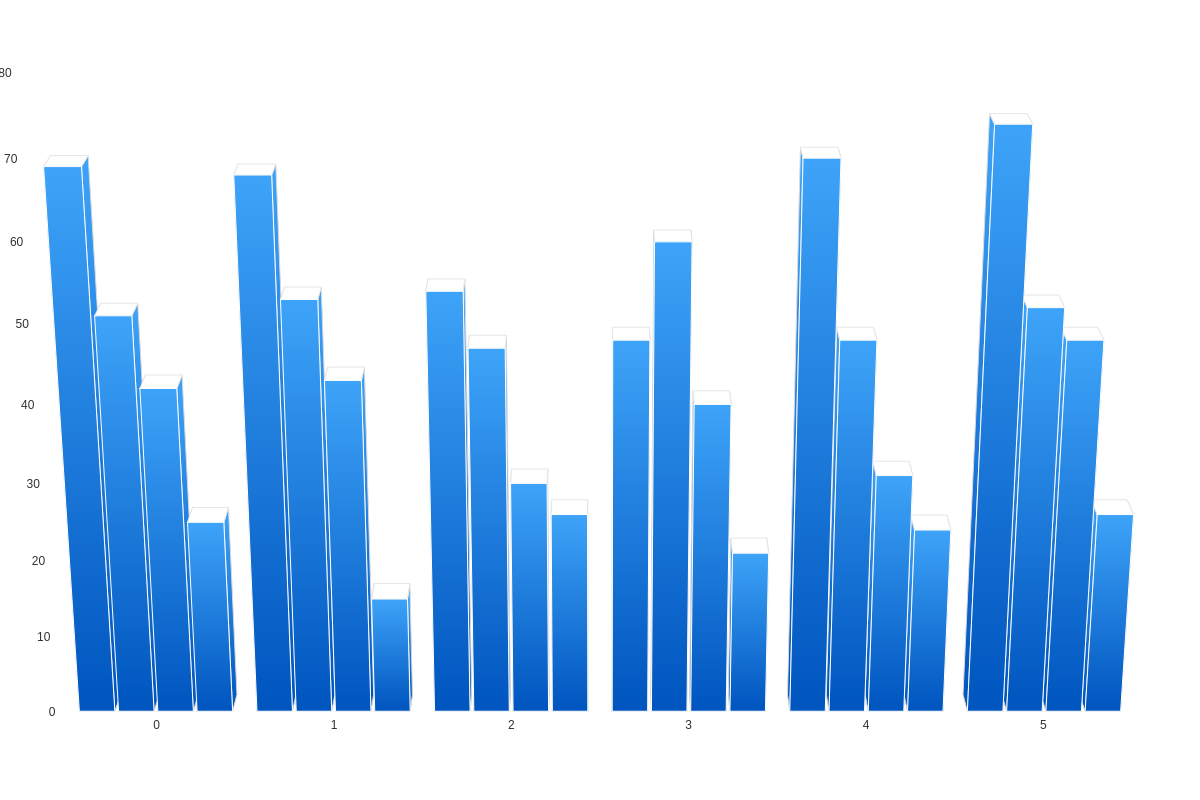
The above demo uses facets within the "plot" object. Below, you'll see a demo in which facets are used within each object of the "series" array to style each plot differently.
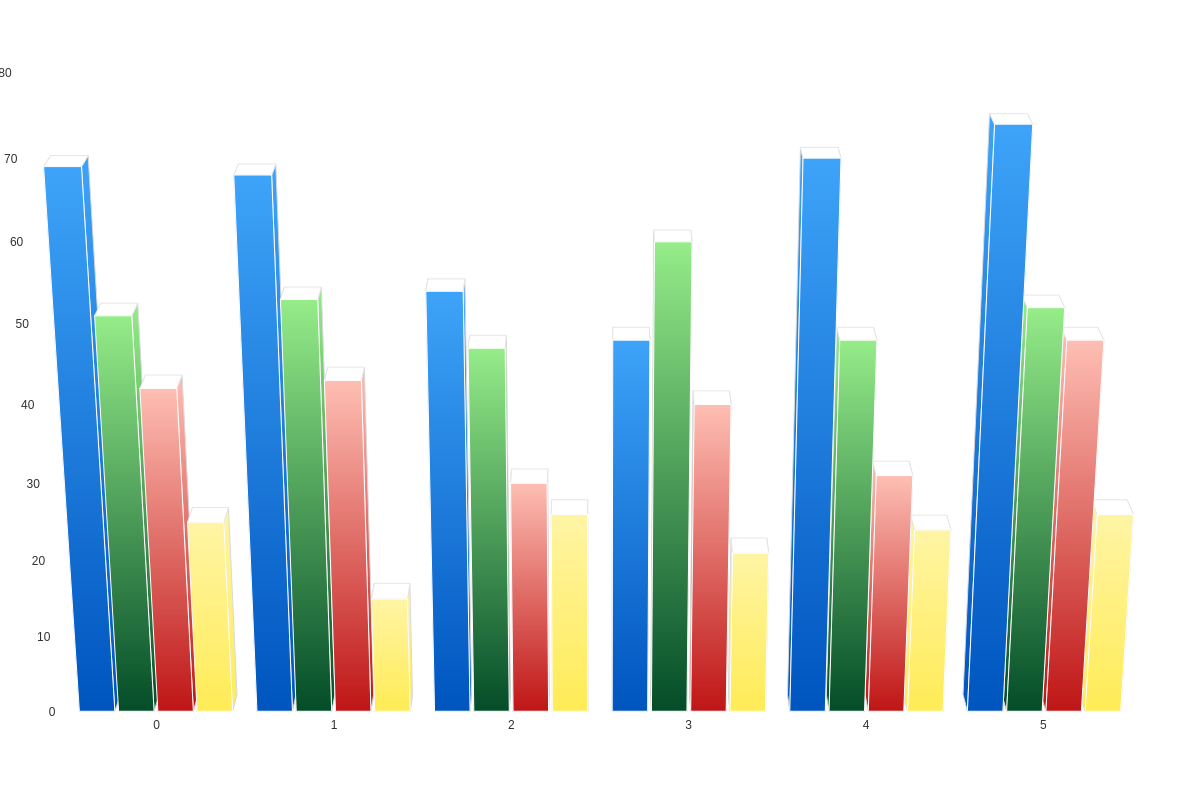
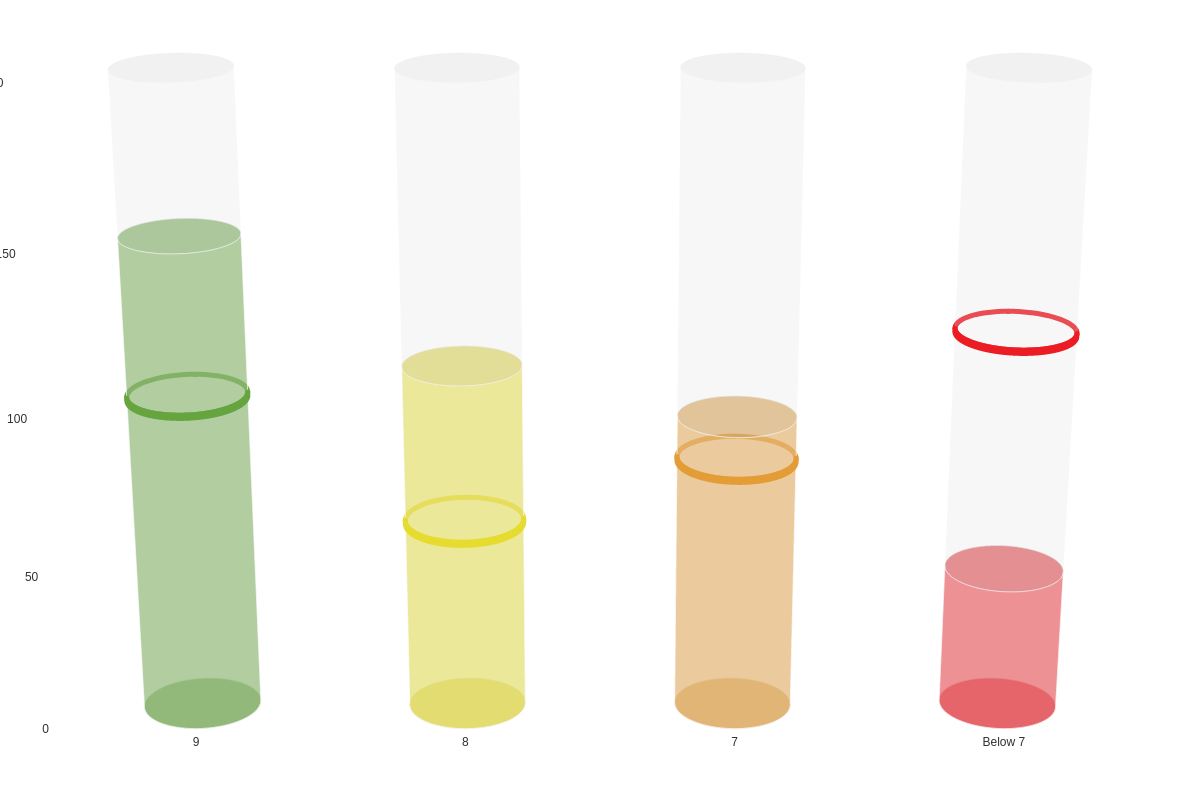
The following demo uses facets to style the goal rings around each cylinder -- they're actually cylinders themselves! Right-click on the chart and select "View Source" to view our JSON. The possibilities are endless when you use a bit of creativity!
Thickness
For "pie3d" and "ring3d" charts, configure the thickness of the chart using the thickness attribute
{
  type: 'pie3d',  // or 'ring3d'
  plot: {
    thickness: 100,
  }
}
Toolbar
The toolbar module allows viewing the 3D charts in different perspectives by controlling the following properties: x-axis, y-axis, z-axis, depth and zoom.
For more information on how to use modules, check out our ZingChart Modules docs.
zingchart.loadModules('toolbar3d');

  ...

  zingchart.render({
    id: 'myChart',
    data: chartConfig,
    modules: 'toolbar3d'
  });
Toolbar-Specific Properties
Use the options object to configure the 3D toolbar with the following attributes:
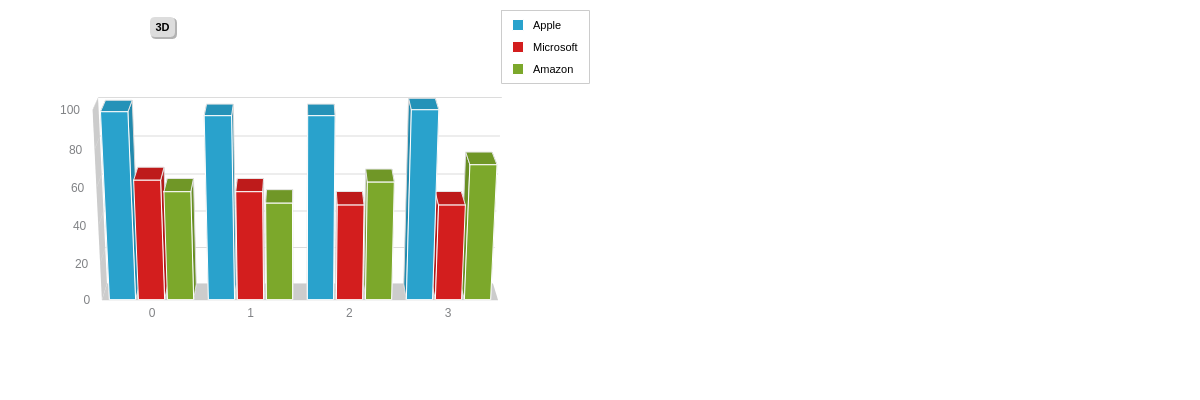
Box
Use the box attribute to configure the toolbar boxed contents, which is visible after opening the toolbar through the "3D" button.
{
  options: {
    backgroundColor: 'red',
  },
}

Mainbox
Use the mainbox attribute to configure the toolbar's main container that holds the toolbar elements, which is visible after opening the toolbar through the "3D" button.
{
  options: {
    mainbox: {
      backgroundColor: 'red',
    },
  },
}

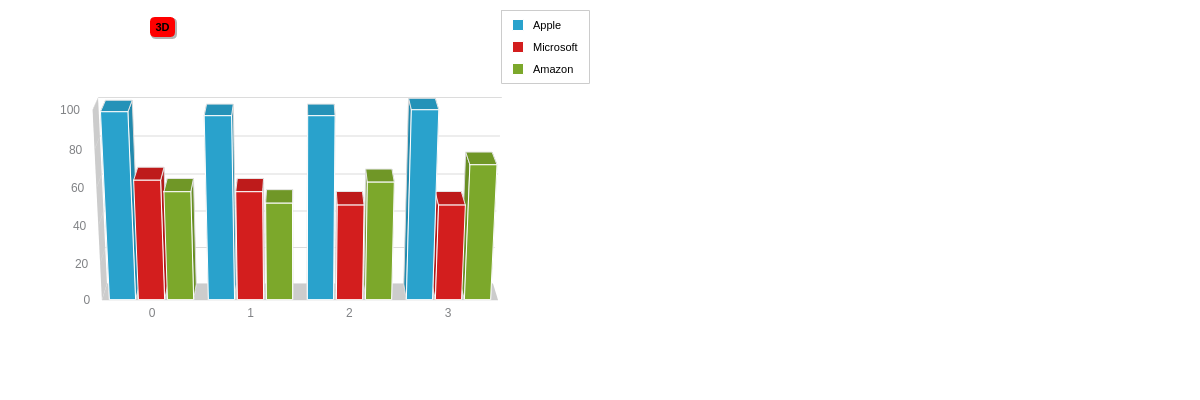
Trigger
Use the trigger attribute to configure the toolbar's trigger button, which opens the toolbar on click.
{
  options: {
    trigger: {
      backgroundColor: 'red',
      hoverState: {
        backgroundColor: 'blue',
      },
    },
  }
}
Zoom
When you are using the true 3D view, you have the option of setting the zoom perspective by using the "zoom" attribute. By default, the zoom perspective is set to 1.0. If you are using a value less than 1.0, the leading 0 is required before the decimal.
type: 'bar3d',
  '3d-aspect': {
    zoom: 0.7
  }
Summary
This was just a small taste of what you can accomplish using the 3D attributes. Try using them on different chart types to see what you can come up with.
Don't forget, a comprehensive list of available attributes and objects can be found on our JSON Syntax page.