Using JSON Data To Make Charts
Using JSON Data to Make Charts
Overview
JSON (JavaScript Object Notation) is a format that uses human-readable text to transmit data objects. By externalizing our chart data, we can reference our data from multiple locations and set caching options.
Loading an External JSON Data File
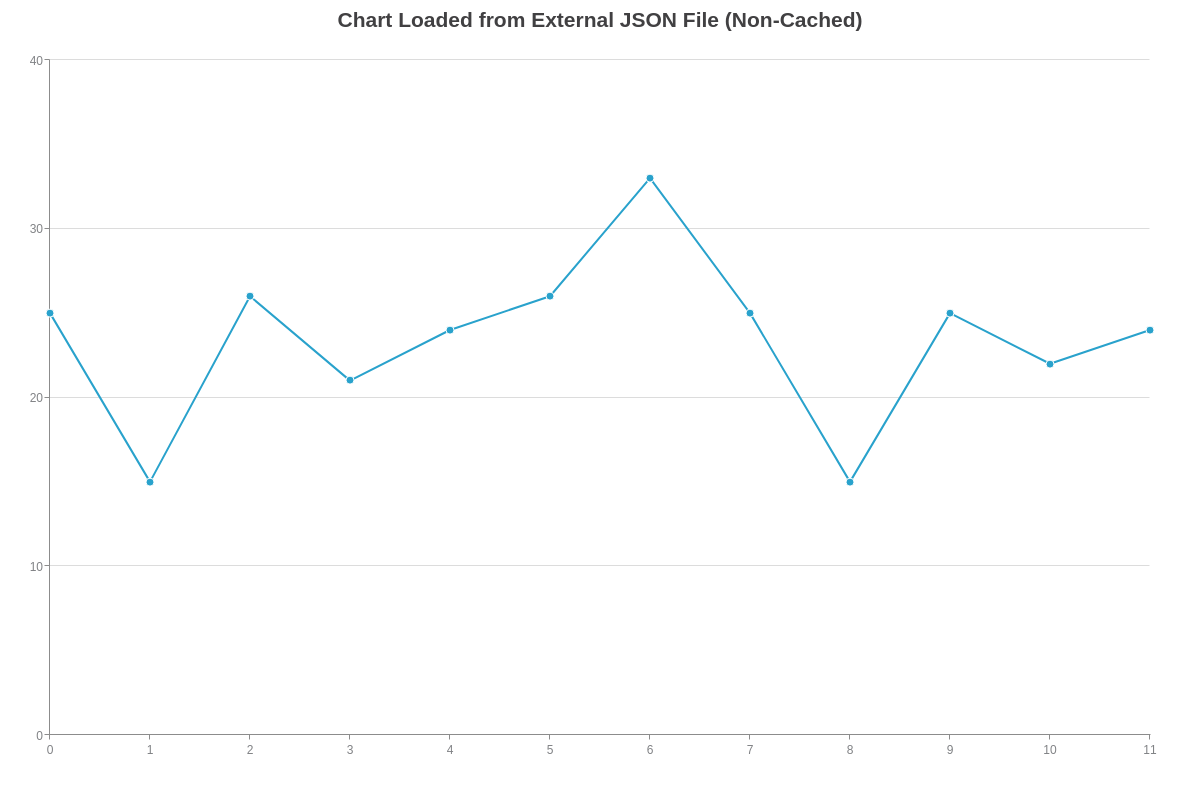
Here are the contents of our chart.json file:
{
  type: 'line',
  title: {
    text: 'Chart Loaded from External JSON File'
  },
  series: [
    {
      values: [25,15,26,21,24,26,33,25,15,25,22,24]
    }
  ]
}
Caching
The cache option of the zingchart.render method allows us to set the caching options for chart data, theme defaults, CSS files, and CSV files.
{
  data: true | false
  defaults: true | false
  css: true | false
  csv: true | false
}
In this case, we will only cache the data file used to create our chart.
zingchart.render({
  id: 'myChart',
  output: 'svg',
  height: '400px',
  width: '100%',
  dataurl: 'resources/cachedchart.json',
  cache: {
    data: true
  }
});
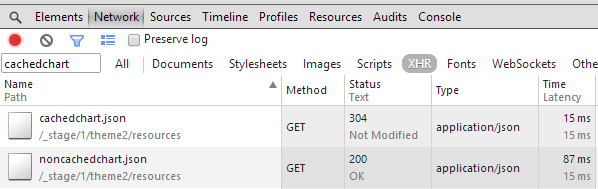
If you would like to see how caching affects the performance of your chart, use your browser's developer tools to view the individual network connections. When data caching is set to false, ZingChart will always make a network request for the external file. With data caching set to true, ZingChart will use the chart data stored in the cache, reducing the number of network requests.
This chart uses caching:

This chart does not use caching:
We can see the benefits of caching chart data by using the network panel in our browser's developer tools. This allows us to see the difference in the amount of time needed to load the chart data. When the data is cached, the browser will use the cached version, as long as the resource has not been modified since it was originally cached. When the data is not cached, the browser will load the resource every time the chart is rendered.
Summary
The ability to use external JSON data files is another great example of what makes ZingChart the most flexible charting library out there!