Bubble Pack Charts
Note: See our Bubble Chart Gallery for inspiration on all the different bubble pack chart possibilities.
Bubble Pack Chart Types and Options
ZingChart bubble pack charts (aka bubble clouds or packed circle charts) use the type attribute and the options object. In your chart object, add a type attribute and set the value to bubble-pack. Next, create an options object.
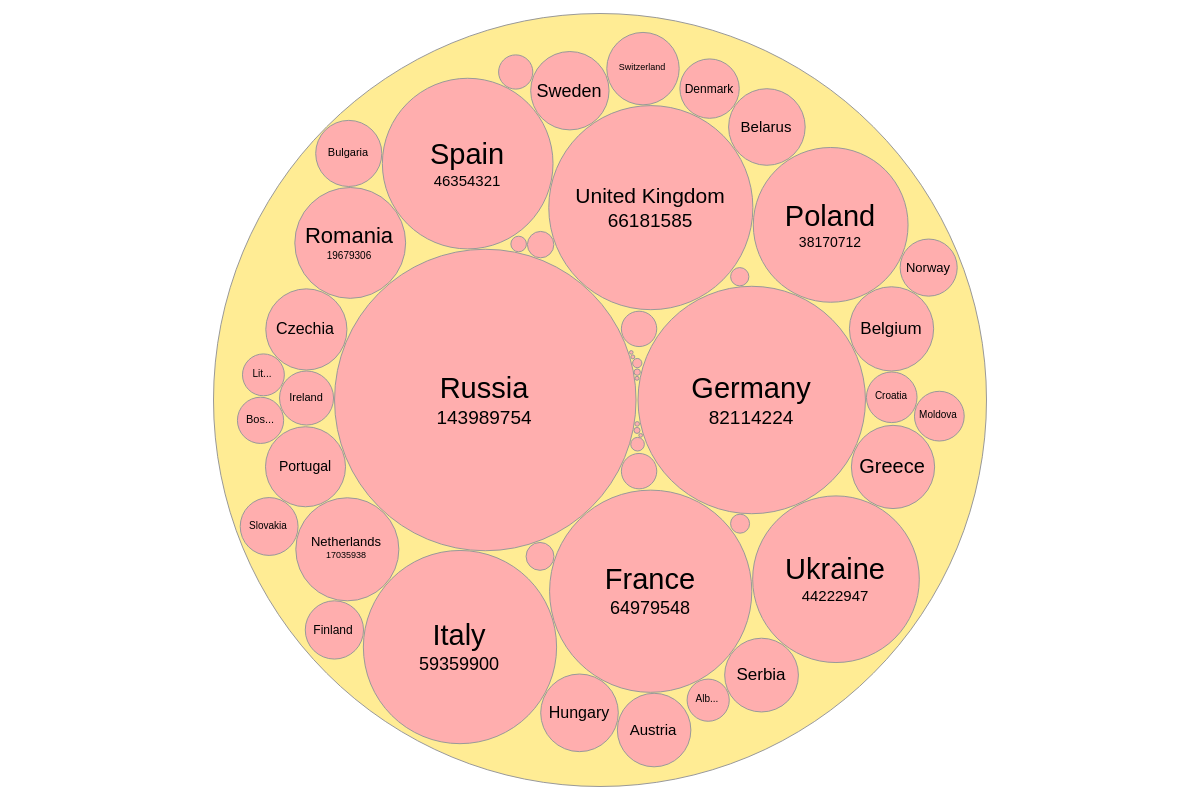
Without further modification, here is how the default bubble pack chart appears:
{
	type: 'bubble-pack',
	plotarea: {
	  margin: 10
	},
	series: chartData
}
Data
Provide your chart data in the series array. In the array, create an object and assign a value to the id, parent, name, value, and group attributes.
id is the bubble id; parent specifies the parent bubble id; name is the name of the bubble; value is the numerical value of the bubble object being added; and group is specifies which group the bubble is placed in.
series: [
  {id: 'theworld', parent: '', name: 'The World', group: ''},
  {id: 'denmark', parent: 'theworld', name: 'Denmark', value: 5733551, group: 'europe'},
  {id: 'finland', parent: 'theworld', name: 'Finland', value: 5523231, group: 'europe'},
  {id: 'norway', parent: 'theworld', name: 'Norway', value: 5305383, group: 'europe'},
  ...,
  {id: 'someId', parent: 'someParentId', name: 'someName', value: someValue, group: 'someGroup'}
]
Chart-Specific Properties
You can use the options object to configure the bubble pack chart with format, groupFilter, maxItems, minSize, padding, and palette properties.
active
Drilldown is enabled by default. Set the active attribute to false to disable bubble pack drilldown on click.
type: 'bubble-pack',
	options: {
		active: false,
	}
containers
Use containers to display multiple bubbles.
{
    type: 'bubble-pack',
    options: {
			containers: {
				europe: {
					height: '50%',
					width: '33%',
					x: '0%',
					y: '0%',
					borderColor: 'red'
				},
				....
			}
    }
}

format
The format object is used to configure how data is displayed inside of the bubbles. Within the format object, use these attributes to change the configuration: short, decimals, decimalsSeparator, and thousandsSeparator.
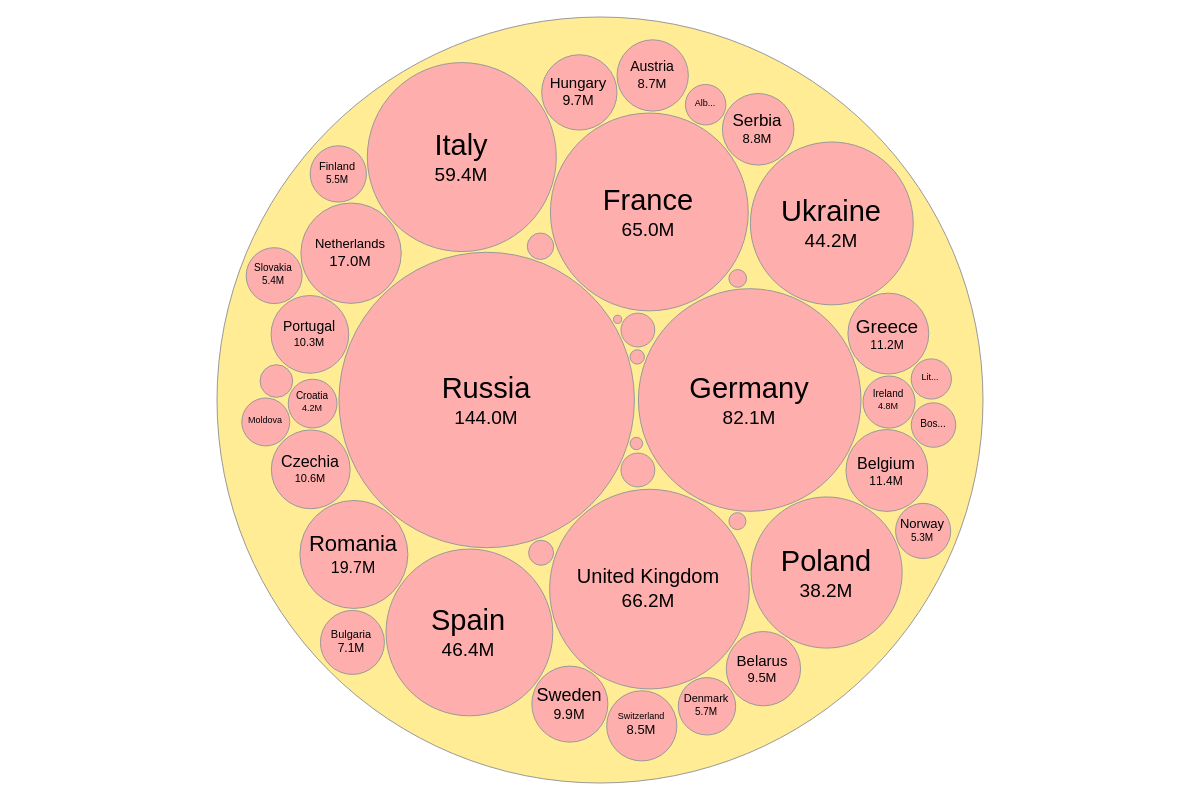
Setting short: true writes the bubble values in shorthand; decimals specifies how many decimal places of the bubble value will be displayed; decimalsSeparator and thousandsSeparator specify the separator used for the decimal position and the thousands position.
short: true Bubble Pack Chart
{
	type: 'bubble-pack',
	options: {
	  format: {
	    short: true,
	    decimals: 1,
	    decimalsSeparator: '.',
	    thousandsSeparator: ','
	  }
	}
}
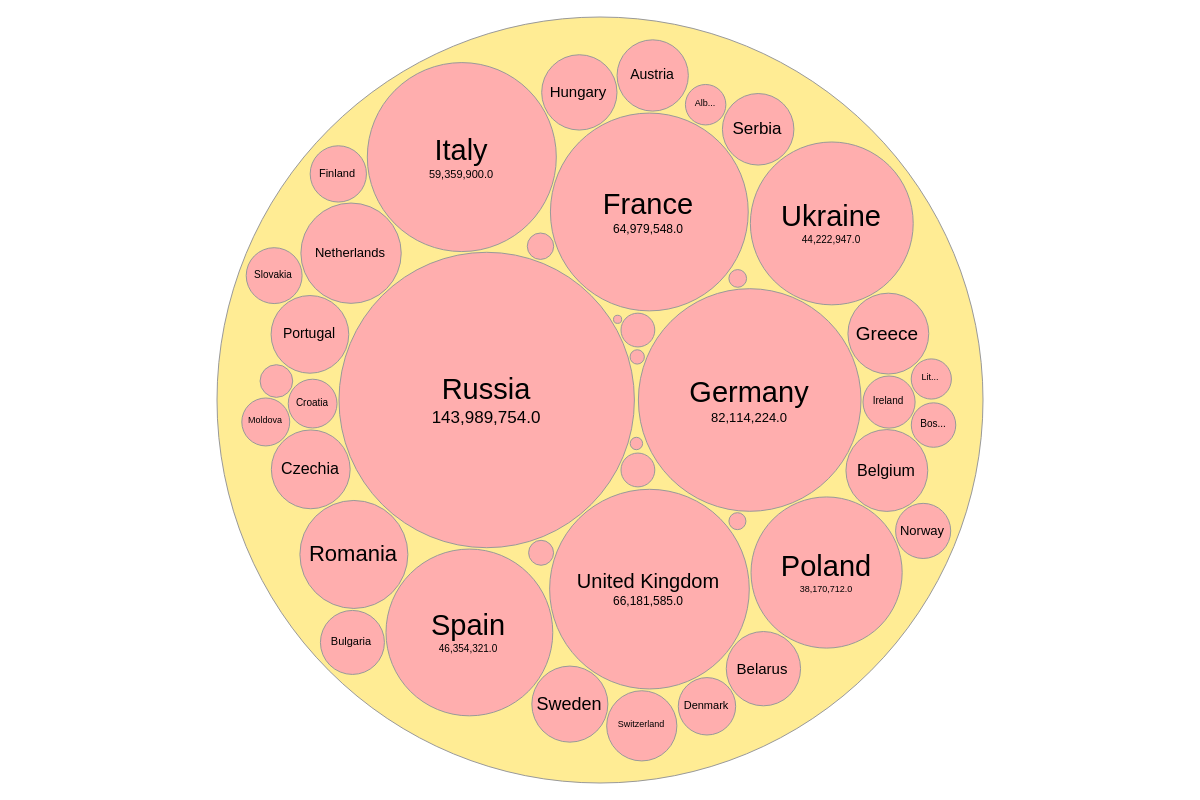
short: false Bubble Pack Chart
{
	type: 'bubble-pack',
	options: {
	  format: {
	    short: false,
	    decimals: 1,
	    decimalsSeparator: '.',
	    thousandsSeparator: ','
	  }
	}
}
groupFilter
The groupFilter array lets you choose which groups to display on the chart. The data may contain multiple groups; just add the group names as comma separated strings inside the groupFilter array. You can also use groupFilter to filter out data you don't want displayed.
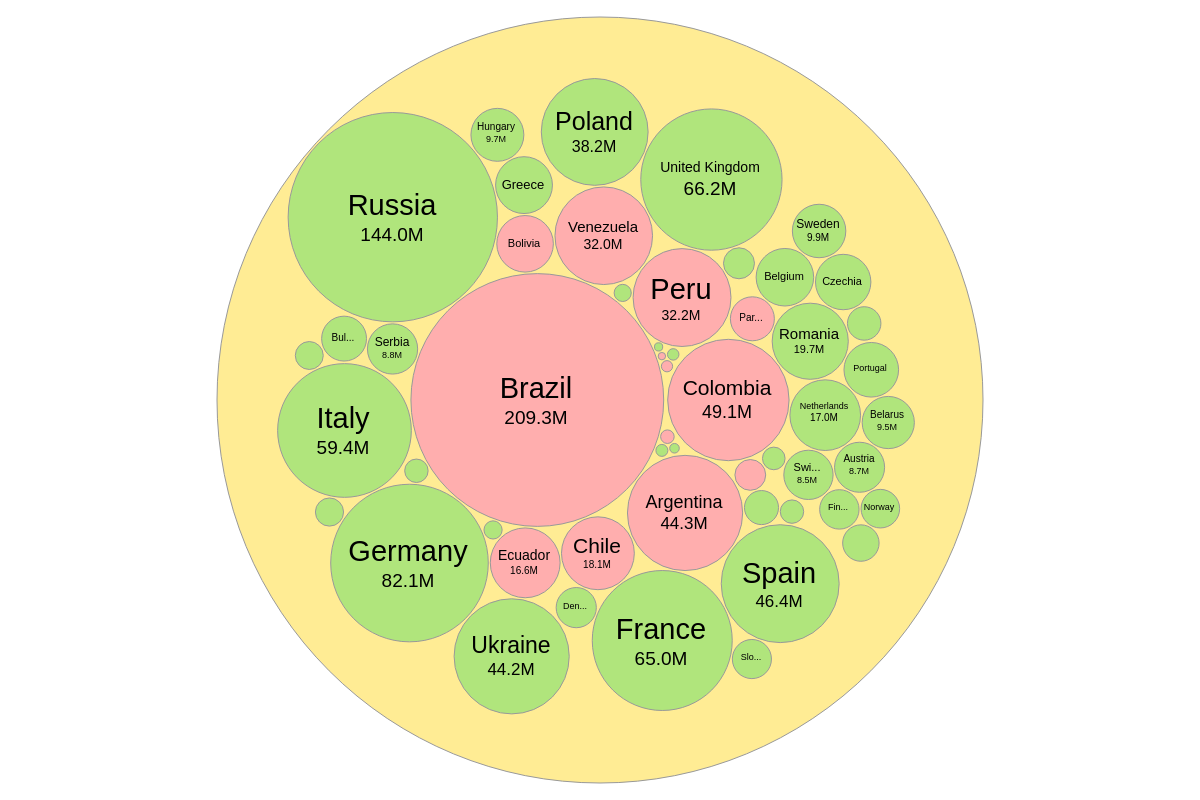
groupFilter: ['southamerica', 'europe'] Bubble Pack Chart
{
	type: 'bubble-pack',
	options: {
	  groupFilter: ['southamerica', 'europe'],
	},
	series: chartData
}
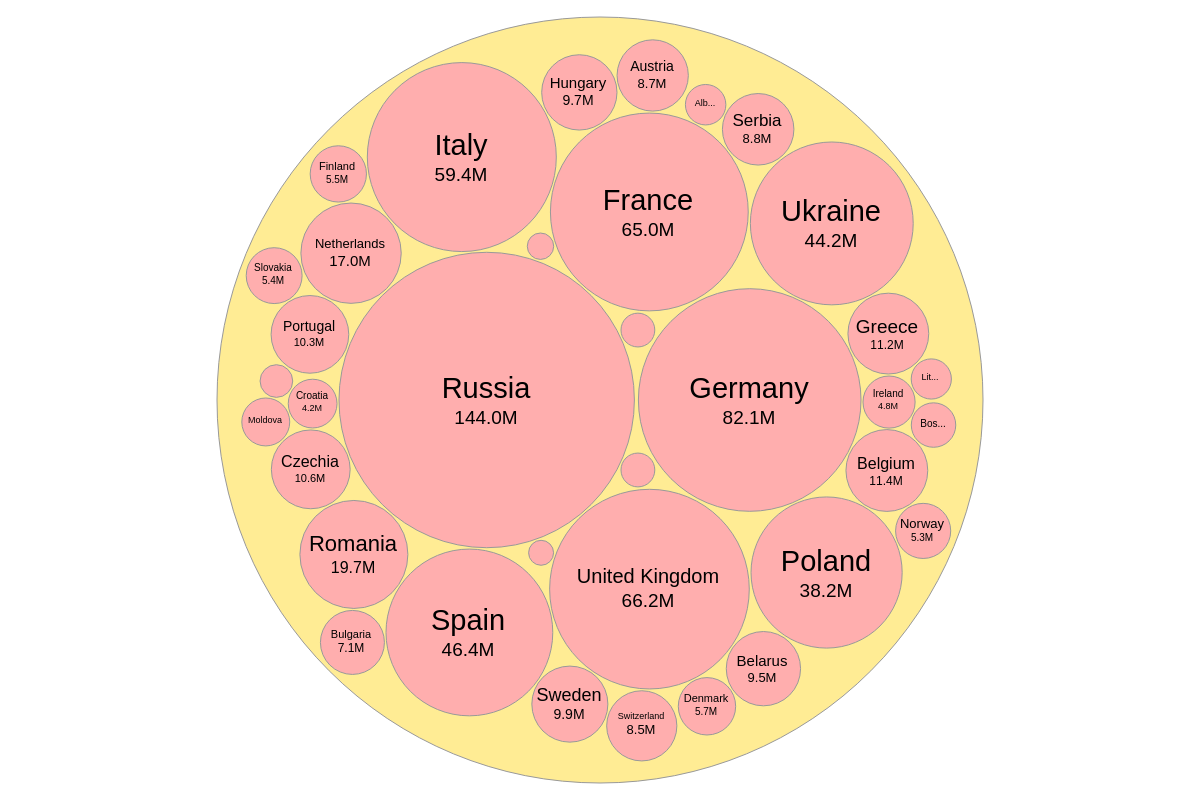
groupFilter: ['europe'] Bubble Pack Chart
Here is a bubble pack chart that uses groupFilter to only show European countries:
{
	type: 'bubble-pack',
	options: {
	  groupFilter: ['europe']
	}
}
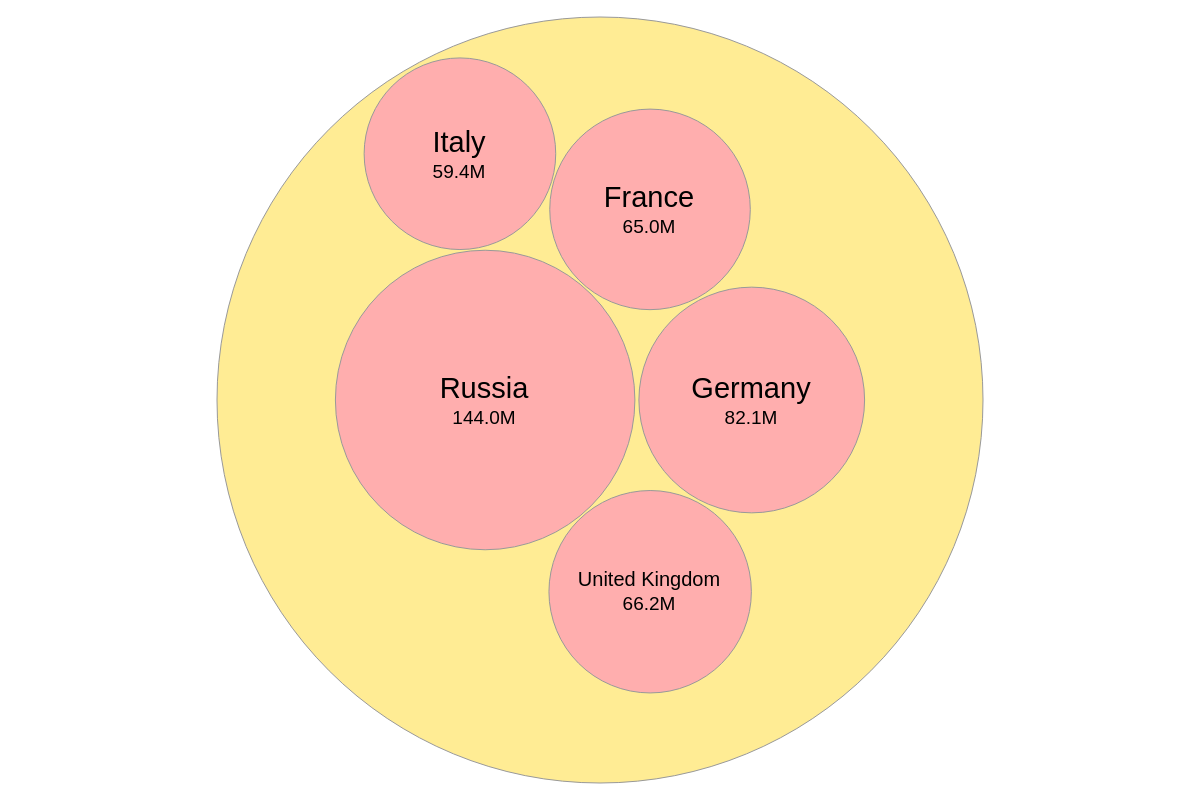
maxItems
Use maxItems to display a maximum number of bubbles in a bubble pack group.
{
    type: 'bubble-pack',
    plotarea: {
      margin: 10
    },
    options: {
      maxItems: 5
    }
}
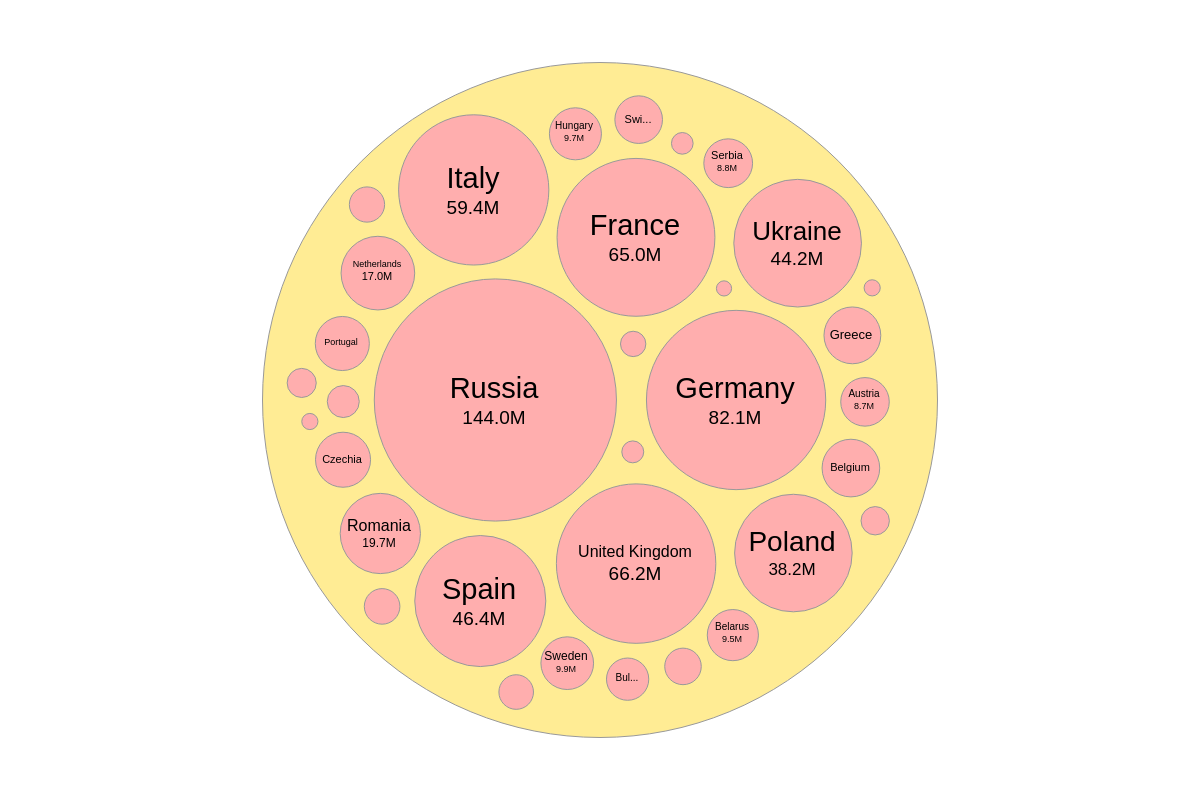
minSize
Use minSize to display bubbles with a minimum pixel size.
{
    type: 'bubble-pack',
    plotarea: {
      margin: 10
    },
    options: {
      padding: '2px',
      minSize: '30px'
    }
}

mode
Use mode to determine if bubbles should fill in gaps ('auto') or not ('fast').
{
    type: 'bubble-pack',
    options: {
      mode: 'fast',
    }
}
padding
Use padding to add padding around the bubbles in the chart.
{
    type: 'bubble-pack',
    plotarea: {
      margin: 10
    },
    options: {
      padding: '15px'
    }
}
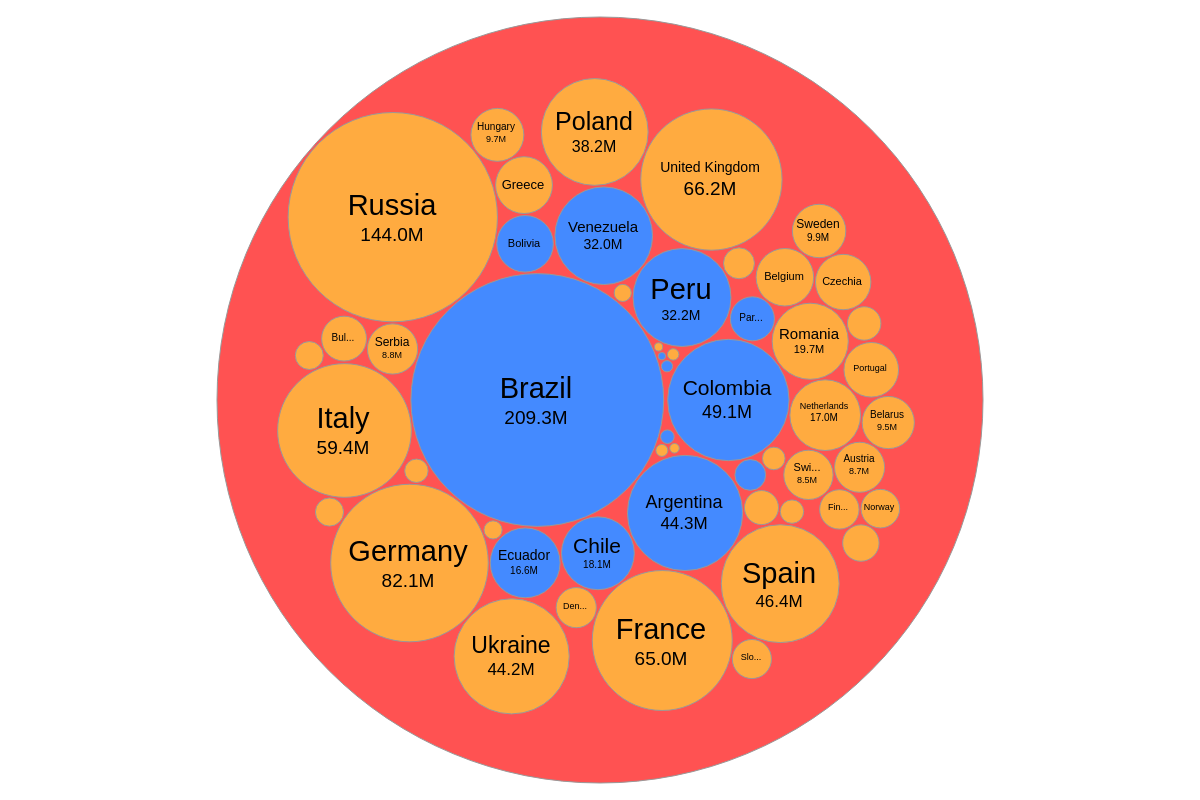
palette
The palette array will allow you to change the colors of the bubbles. The first index is the background color for the overall bubble. The subsequent indices are for colors of bubbles.
options: {
	palette: ['#ff5252', '#448aff', '#ffab40'],
}
Further Customization
Once you have your bubble-pack chart, you can customize and style the bubbles to fit your data visualization needs.
Styling Attributes
The following attributes can be used to style grid charts:
| Attribute | Description |
|---|---|
bubble |
Defines the style for all bubbles |
bubble-id-n |
Defines the style for bubbles with id 'n' |
bubble-group-n |
Defines the style for bubbles in group 'n' |
bubble-level-n |
Defines the style for bubbles in level 'n' |